

A | B | C | D | E | F | G | H | CH | I | J | K | L | M | N | O | P | Q | R | S | T | U | V | W | X | Y | Z | 0 | 1 | 2 | 3 | 4 | 5 | 6 | 7 | 8 | 9

Denmark was a pioneer in developing commercial wind power during the 1970s, and today a substantial share of the wind turbines around the world are produced by Danish manufacturers such as Vestas—the world's largest wind-turbine manufacturer—along with many component suppliers. Furthermore, Denmark has{Emdash}}as of 2022{Emdash}}the 2nd highest amount in the world of wind power generation capacity installed per capita, behind only neighboring Sweden.
In 2020, wind power produced 56% of total electricity generation in Denmark, up from 20% in 2010 and 11% in 2000.[2][3][4][5][6][7][8] This contributes to the government's target of 100% renewable power generation by 2030.[9][10]
Denmark had the 4th best energy architecture performance in the world in 2017 according to the World Economic Forum,[11] and the second best energy security in the world in 2019 according to the World Energy Council.[12]
History

Danish inventor Poul la Cour experimented, taught and constructed wind power projects around the year 1900.[13][14]
As concerns over global warming grew in the 1980s, Denmark found itself with relatively high carbon dioxide emissions per capita, primarily due to the coal-fired electrical power plants that had become the norm after the 1973 and 1979 energy crises.[15] Renewable energy became the natural choice for Denmark, decreasing both dependence on other countries for energy and global warming pollution.
Many countries tried to subsidise green technology such as wind power, and most failed to make a viable industry. The Danish system was an exception, providing 30% of initial capital cost in the early years which was gradually reduced to zero, but still maintaining a feed-in tariff.[16] The capital cost subsidy was reduced to 20% in June 1985, when wind turbines received DKK 50 million per year. Other renewable energy forms received 37 million.[17] The research institution Teknologisk Institut identified many specific improvement needs, pushing development from ad hoc to systemised solutions.[18]
On 29 March 1985, one year before the Chernobyl disaster, the Danes passed a law forbidding the construction of nuclear power plants. In the process the Danish grassroots movement had a substantial role. The Danish Anti-nuclear Movement's (OOA) smiling-sun logo "Atomkraft, Nej Tak" ("Nuclear Power, No Thanks") spread worldwide, and the renewable alternatives were promoted by the Danish Organisation for Renewable Energy (OVE).
Denmark adopted a target of cutting carbon emissions by 22% from 1988 levels by 2005.[15] Planning of wind power was deliberately streamlined by authorities to minimise hurdles.[19]
Policy measures
In June 2005, the Danish government published Energy Strategy 2025, which replaced the previous strategy from 1996. The strategy formulates policy projects that are intended to accelerate the expansion of wind power and restructure the electricity market. [20] [21]
The Danish government also succeeded in drawing up energy agreements from 2008 to 2011 with broad-based support, which included the most far-reaching and effective programs for the expansion of wind energy to date.[22] The parties agreed that the share of renewable energies in Danish energy consumption should be 20 % in 2011. The price for wind energy was also increased in the agreement. The parties also agreed to construct new offshore wind turbines with a capacity of 400 MW by 2012. The agreement introduced a compensation scheme for residents living near wind turbines, a scheme for purchase rights and a guarantee fund.[23] [24]
After the government expressed the long-term vision of a Denmark 100% independent of reliance on fossil fuels[25] during the current agreement, in independent commission on climate change policy proposed detailed recommendations in September 2010 on how this vision can be achieved. This led to Energy Strategy 2050 a year later. The strategy consists of three tracks, as one of them focusses on more renewable energy with onshore and offshore wind power. It included tenders for over 1000 MW in offshore including Kriegers Flak in the Baltic Sea. Kriegers Flak is also used to connect Denmark and Germany with a 400MW cable, through the German Baltic 2 Offshore Wind Farm,[26] and it is the wind farm with the lowest guaranteed price (øre/kWh) for large offshore wind farms in Denmark.[27] In addition, the distance requirements for wind turbines were evaluated and revised. Such subsidies as compensation schemes for residents living near onshore wind mills lost relevance and the offshore area was taken into focus.[28][29]
Ever since the first energy agreement with outstanding consensus in parliament in 2008, Denmark grew their wind power share in domestic electricity production from 19% to 55% in 2019.[30]
For the policy approach, one may note the adoption of incrementalism that helps this to be developed ahead of other more rational approaches such as those adopted by USA and UK. See the use of Wind Power development in the example section of Incrementalism.
Wind resources
| External images | |
|---|---|
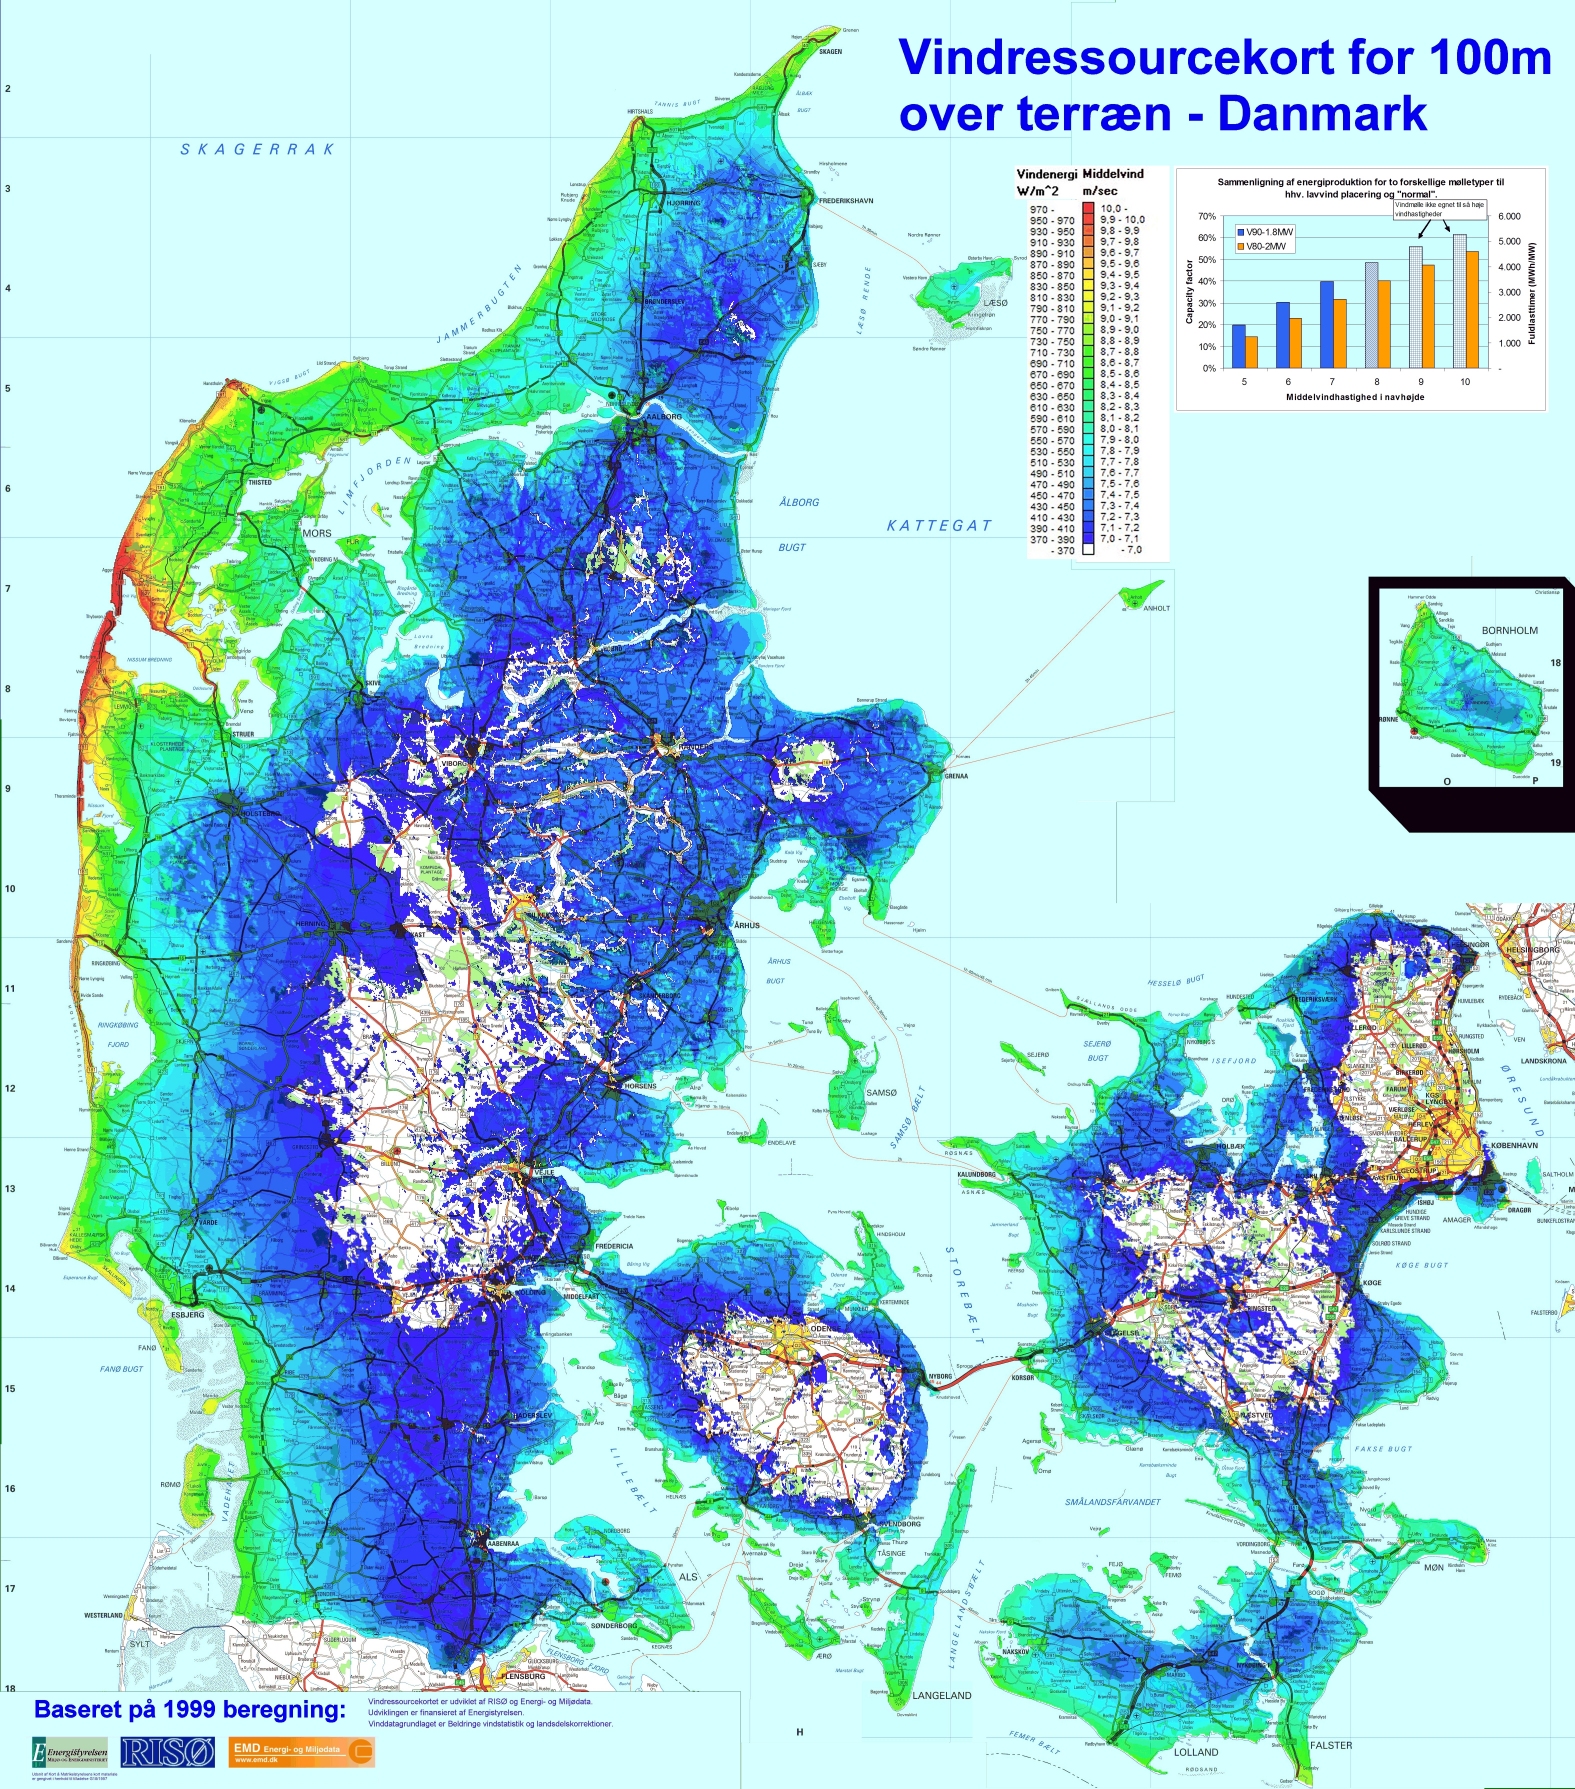
Denmark has relatively modest average wind speeds in the range of 4.9–5.6 m/s measured at 10 m height. Onshore wind resources are highest in the western part of the country, and on the eastern islands with coastlines facing south or west. Wind is higher in autumn and winter and lower in summer, and Denmark also has about 2.3 GW of solar power.[31][32] The country has very large offshore wind resources, and large areas of sea territory with a shallow water depth of 5–15 m, where siting is most feasible. These sites offer higher wind speeds, in the range of roughly 8.5–9.0 m/s at 50 m height.[33] There have been no major problems from wind variability, although there is a temporary problem resulting from the connection of a large bloc of wind power from offshore wind farms to a single point on a weak section of the transmission network.[34] The wind resource over Denmark was mapped in 1999 by EMD International A/S and Risø National Laboratory. The mapping was made using a 200 m grid resolution using the models in WindPRO and WAsP. The results were validated on more than 1200 wind turbines nationwide.[35]
Denmark is connected by transmission line to other European countries (e.g. Cross-Skagerrak)[36] at an electricity interconnection level (transmission capacity relative to production capacity) of 44% in 2015,[37] and increased since then. Denmark has also retained 6 GW of its traditional power plants,[32] therefore it does not need to install additional peak-load plants to balance its wind power. Instead, it purchases additional power from its neighbours when necessary. With some strengthening of the grid, Denmark plans to increase wind's share even further.[38] In 2010 the plan was to reach 50% of consumption in 2020[39] (which was almost met), and up to 84% in 2035.[40]
Analysts expect the cost of wind power to be 30 øre/kWh and its handling cost to be 15 øre/kWh, being lower than coal and natural gas at 55 øre/kWh minimum.[41] Due to their inability to follow load wind power gets a lower price.[42]
Danish district heating plants use 100 petajoule/year,[43] but little of this consumption is from 180 MW of electrode boilers installed in powerplants or 374 MW of large heat pumps.[44] The boilers are only used to soak up the powerplant's own electricity when prices are negative, to avoid paying tax.[45][46][47][48] Expansion of wind powered district heating is calculated to be economically efficient without taxes.[49][50][51]
The number of household heat pumps has stalled at 70,000 in 2015 due to tax-free wood pellets, and the goal of 300,000 small heat pumps in 2035 is unlikely to be reached, reducing the value of more wind power unless electricity tax is reduced.[52]
Nameplate capacities and production

At the end of 2015[update], Denmark's total nameplate capacity for wind power stood at 5,070 MW.
Denmark has the highest proportion of wind power in the world. In 2015, Denmark produced 42% of electricity from wind,[53][5] up from the 2014 record of 39% of total power consumption. For the month of January 2014, that share was over 61%. The month of lowest wind power share was July at 23%.[6] Denmark also had 548 MW of solar power[54] (790 MW in late 2015).[55] A peak generation period occurred on 21 December 2013 when the wind share was 102%, and for 1 hour the share was 135%.[8]
In 2005, Denmark had installed wind capacity of 3,127 MW, which produced 23,810 TJ (6.6 TW·h) of energy, giving an actual average production of 755 MW at a capacity factor of 24%.[56] In 2009, Denmark's wind capacity grew to 3,482 MW; most of the increase came from the 209 MW Horns Rev 2 offshore wind farm, which was inaugurated on 17 September 2009 by Crown Prince Frederik.[57] In 2010, capacity grew to 3,752 MW, and most of the year's increase came from the Rødsand II off-shore wind farm.
On 22 March 2012, a coalition of parties representing 95% of all members of the Danish parliament agreed that the Danish state would increase the country's offshore wind capacity by 1,500 MW.[58][59] The 1,500 MW extra capacity was achieved by constructing several offshore wind farms; the 400 MW Anholt wind farm in 2014,[6] the 407 MW Horns Rev 3 in the North Sea[59] at 77 øre/kWh[60] in 2019,[61][62] and the Kriegers Flak at 37.2 øre/kWh[63] with a capacity of 600 MW in the Baltic Sea close to the borders of Germany and Sweden in 2021.[59] Kriegers Flak is also used to connect Denmark and Germany with a 400MW cable, through the German Baltic 2 Offshore Wind Farm,[64] and Energinet ordered electrical equipment in early 2016.[65][66] Eight groups applied for pre-qualification for Kriegers Flak,[67] of which 7 were approved[68] – 3 more than the 4 companies approved to compete for Horns Rev 3,[69] both having more bidders than the single bidder for Anholt. By 2018, Danish offshore wind farms had average 40% capacity factor. Newer farms had higher CF than older.[70]
Offshore operators are required to secure a decommissioning fee.[71]
Wind power output reduces spot market prices in general via the Merit Order effect; in 2008 this caused a net reduction of pre-tax electricity prices (balancing the increase from the feed-in law).[72]
Statistics
| External image | |
|---|---|
| Year | 1970 | 1971 | 1972 | 1973 | 1974 | 1975 | 1976 | 1977 | 1978 | 1979 |
|---|---|---|---|---|---|---|---|---|---|---|
| Installed wind capacity (kW)[75] | 52 | 813 | 1,090 | |||||||
| Electricity generated (MW·h)[75] | 120 | 240 | ||||||||
| Average capacity factor (%) | — | 1.7 | 2.5 | |||||||
| Year | 1980 | 1981 | 1982 | 1983 | 1984 | 1985 | 1986 | 1987 | 1988 | 1989 |
| Installed wind capacity (MW)[75] | 2.7 | 6.3 | 10.6 | 14.3 | 19.8 | 47.0 | 72.4 | 111.9 | 190.3 | 246.7 |
| Electricity generated (GW·h)[75] | 2 | 5 | 12 | 19 | 26 | 44 | 104 | 154 | 266 | 398 |
| Average capacity factor (%) | 8.5 | 9.1 | 12.9 | 15.2 | 15.0 | 10.7 | 16.4 | 15.7 | 16.0 | 18.4 |
| Year | 1990 | 1991 | 1992 | 1993 | 1994 | 1995 | 1996 | 1997 | 1998 | 1999 |
| Installed wind capacity (MW)[75] | 326 | 393 | 436 | 468 | 521 | 600 | 814 | 1,123 | 1,438 | 1,753 |
| Electricity generated (TW·h)[75] | 0.57 | 0.68 | 0.83 | 0.92 | 1.06 | 1.09 | 1.19 | 1.89 | 2.76 | 3.00 |
| Average capacity factor (%) | 20.0 | 19.8 | 21.7 | 22.4 | 23.2 | 20.7 | 16.7 | 19.2 | 21.9 | 19.5 |
| Year | 2000 | 2001 | 2002 | 2003 | 2004 | 2005 | 2006 | 2007 | 2008 | 2009 |
| Installed wind capacity (MW)[75] | 2,390 | 2,497 | 2,890 | 3,116 | 3,123 | 3,127 | 3,135 | 3,124 | 3,163 | 3,482 |
| Electricity generated (TW·h)[75] | 4.22 | 4.31 | 4.86 | 5.56 | 6.58 | 6.61 | 6.11 | 7.14 | 6.98 | 6.72 |
| Average capacity factor (%) | 20.2 | 19.7 | 19.2 | 20.4 | 24.1 | 24.1 | 22.2 | 26.1 | 25.2 | 22.0 |
| Wind power share in the electricity supply (%)[76] | 12.1 | 12.2 | 13.9 | 15.8 | 18.5 | 18.5 | 16.8 | 19.7 | 19.1 | 19.3 |
| Year | 2010 | 2011 | 2012 | 2013 | 2014 | 2015 | 2016 | 2017 | 2018 | 2019 |
| Installed wind capacity (MW)[8][75][77] | 3,752 | 3,927 | 4,162 | 4,792 | 4,855 | 5,070 | 5,229 | 5,475 | 6,131 | 6,128 |
| Electricity generated (TW·h)[73] | 7.81 | 9.77 | 10.27 | 11.12 | 13.08 | 14.13 | 12.78 | 14.78 | 13.90 | 16.15 |
| Average capacity factor (%) | 23.8 | 28.4 | 28.2 | 26.5 | 30.8 | 31.8 | 27.9 | 30.8 | 25.9 | 30.1 |
| Wind power share in domestic electricity production (%)[73] | 20.2 | 28.0 | 33.7 | 32.2 | 41.0 | 49.2 | 42.5 | 48.6 | 46.1 | 55.2 |