

A | B | C | D | E | F | G | H | CH | I | J | K | L | M | N | O | P | Q | R | S | T | U | V | W | X | Y | Z | 0 | 1 | 2 | 3 | 4 | 5 | 6 | 7 | 8 | 9
This article needs to be updated. (March 2020) |

The federal government has a 6.75 to 1 debt to revenue ratio as of Q2 2023.

| This article is part of a series on the |
| Budget and debt in the United States of America |
|---|
  |

The national debt of the United States is the total national debt owed by the federal government of the United States to Treasury security holders. The national debt at any point in time is the face value of the then-outstanding Treasury securities that have been issued by the Treasury and other federal agencies. The terms "national deficit" and "national surplus" usually refer to the federal government budget balance from year to year, not the cumulative amount of debt. In a deficit year the national debt increases as the government needs to borrow funds to finance the deficit, while in a surplus year the debt decreases as more money is received than spent, enabling the government to reduce the debt by buying back some Treasury securities. In general, government debt increases as a result of government spending and decreases from tax or other receipts, both of which fluctuate during the course of a fiscal year.[1] There are two components of gross national debt:[2]
- "Debt held by the public" – such as Treasury securities held by investors outside the federal government, including those held by individuals, corporations, the Federal Reserve, and foreign, state and local governments.
- "Debt held by government accounts" or "intragovernmental debt" – is non-marketable Treasury securities held in accounts of programs administered by the federal government, such as the Social Security Trust Fund. Debt held by government accounts represents the cumulative surpluses, including interest earnings, of various government programs that have been invested in Treasury securities.

Historically, the U.S. public debt as a share of gross domestic product (GDP) increases during wars and recessions and then subsequently declines. The ratio of debt to GDP may decrease as a result of a government surplus or via growth of GDP and inflation. The Congressional Budget Office (CBO) estimated in February 2024 that Federal debt held by the public is projected to rise from 99 percent of GDP in 2024 to 116 percent in 2034, and would continue to grow if current laws generally remained unchanged. Over that period, the growth of interest costs and mandatory spending outpaces the growth of revenues and the economy, driving up debt. Those factors persist beyond 2034, pushing federal debt higher still, to 172 percent of GDP in 2054.[3] In recent decades, aging demographics and rising healthcare costs have led to concern about the long-term sustainability of the federal government's fiscal policies.[4] The aggregate, gross amount that Treasury can borrow is limited by the United States debt ceiling.[5]
Total US federal government debt breached $30 trillion mark for the first time in history in February 2022.[6] As of December 2023, total federal debt was $33.1 trillion; $26.5 trillion held by the public and $12.1 trillion in intragovernmental debt.[7] In February 2024, the total federal government debt grew to $34.4 trillion after having grown by approximately $1 trillion in both of two separate 100-day periods since the previous June.[8] The annualized cost of servicing this debt was $726 billion in July 2023, which accounted for 14% of the total federal spending.[9] In December 2021, debt held by the public was estimated at 96.19% of GDP, and approximately 33% of this public debt was owned by foreigners (government and private).[10] The United States has the largest external debt in the world. The total number of U.S. Treasury securities held by foreign entities in December 2021 was $7.7 trillion, up from $7.1 trillion in December 2020.[11]
During the COVID-19 pandemic, the federal government spent trillions in virus aid and economic relief. The Congressional Budget Office (CBO) estimated that the budget deficit for fiscal year 2020 would increase to $3.3 trillion or 16% GDP, more than triple that of 2019 and the largest as % GDP since 1945.[12]


History
The United States federal government has continuously had a fluctuating public debt since its formation in 1789, except for about a year during 1835–1836, a period in which the nation, during the presidency of Andrew Jackson, completely paid the national debt. To allow comparisons over the years, public debt is often expressed as a ratio to GDP. The United States public debt as a percentage of GDP reached its highest level during Harry Truman's first presidential term, during and after World War II. Public debt as a percentage of GDP fell rapidly in the post-World War II period and reached a low in 1974 under Richard Nixon. Debt as a share of GDP has consistently increased since then, except during the presidencies of Jimmy Carter and Bill Clinton.
Public debt rose sharply during the 1980s, as Ronald Reagan negotiated with Congress to cut tax rates and increase military spending. It fell during the 1990s because of decreased military spending, increased taxes and the 1990s boom. Public debt rose sharply during George W. Bush's presidency and in the wake of the 2007–2008 financial crisis, with resulting significant tax revenue declines and spending increases, such as the Emergency Economic Stabilization Act of 2008 and the American Recovery and Reinvestment Act of 2009.[13]
In their September 2018 monthly report published on October 5 and based on data from the Treasury Department's "Daily Treasury Statements" (DTS), the Congressional Budget Office (CBO) wrote that the federal budget deficit was c.$782 billion for the fiscal year 2018—which runs from October 2017 through September 2018. This is $116 billion more than in FY2017.[14]: 1 The Treasury statements as summarized by in the CBO report that corporate taxes for 2017 and 2018 declined by $92 billion representing a drop of 31%. The CBO added that "about half of the decline ... occurred since June" when some of the provisions of the Tax Cuts and Jobs Act of 2017 took effect, which included the "new lower corporate tax rate and the expanded ability to immediately deduct the full value of equipment purchases". (~$1.6 trillion in 2023)[14]
According to articles in The Wall Street Journal[15] and Business Insider,[16][15][17] based on documents released on October 29, 2018, by the Treasury Department,[18] the department's projection[16] estimated that by the fourth quarter of the FY2018, it would have issued c. $1.338 trillion (~$1.6 trillion in 2023) in debt. This would have been the highest debt issuance since 2010, when it reached $1.586 trillion (~$2.16 trillion in 2023). The Treasury anticipated that the total "net marketable debt"—net marketable securities—issued in the fourth quarter would reach $425 billion; which would raise the 2018 "total debt issuance" to over a trillion dollars of new debt, representing a "146% jump from 2017".[16] According to the Journal that is the highest fourth quarter issuance "since 2008, at the height of the financial crisis."[15] As cited by the Journal and the Business Insider, the primary drivers of new debt issuance are "stagnant", "sluggish tax revenues", a decrease in "corporate tax revenue",[16] due to the GOP Tax Cuts and Jobs Act of 2017,[15] the "bipartisan budget agreement", and "higher government spending".[15][16]
Valuation and measurement
Public and government accounts

As of July 20, 2020, debt held by the public was $20.57 trillion, and intragovernmental holdings were $5.94 trillion, for a total of $26.51 trillion.[19] Debt held by the public was approximately 77% of GDP in 2017, ranked 43rd highest out of 207 countries.[20] The CBO forecast in April 2018 that the ratio will rise to nearly 100% by 2028, perhaps higher if current policies are extended beyond their scheduled expiration date.[21]
The national debt can also be classified into marketable or non-marketable securities. Most of the marketable securities are Treasury notes, bills, and bonds held by investors and governments globally. The non-marketable securities are mainly the "government account series" owed to certain government trust funds such as the Social Security Trust Fund, which represented $2.82 trillion (~$3.45 trillion in 2023) in 2017.[22]
The non-marketable securities represent amounts owed to program beneficiaries. For example, in the cash upon receipt but spent for other purposes.[sentence fragment] If the government continues to run deficits in other parts of the budget, the government will have to issue debt held by the public to fund the Social Security Trust Fund, in effect exchanging one type of debt for the other.[23][failed verification][dubious ] Other large intragovernmental holders include the Federal Housing Administration, the Federal Savings and Loan Corporation's Resolution Fund and the Federal Hospital Insurance Trust Fund (Medicare).[citation needed]
Accounting treatment


Only debt held by the public is reported as a liability on the consolidated financial statements of the United States government. Debt held by US government accounts is an asset to those accounts but a liability to the Treasury; they offset each other in the consolidated financial statements.[24] Government receipts and expenditures are normally presented on a cash rather than an accrual basis, although the accrual basis may provide more information on the longer-term implications of the government's annual operations.[25] The United States public debt is often expressed as a ratio of public debt to GDP. The ratio of debt to GDP may decrease as a result of a government surplus as well as from growth of GDP and inflation.[citation needed]
Fannie Mae and Freddie Mac obligations excluded
Under normal accounting rules, fully owned companies would be consolidated into the books of their owners, but the large size of Fannie Mae and Freddie Mac has made the U.S. government reluctant to incorporate them into its own books. When the two mortgage companies required bail-outs, White House Budget Director Jim Nussle, on September 12, 2008, initially indicated their budget plans would not incorporate the government-sponsored enterprise (GSE) debt into the budget because of the temporary nature of the conservator intervention.[26] As the intervention has dragged out, pundits began to question this accounting treatment, noting that changes in August 2012 "makes them even more permanent wards of the state and turns the government's preferred stock into a permanent, perpetual kind of security".[27]
The federal government controls the Public Company Accounting Oversight Board, which would normally criticize inconsistent accounting practices, but it does not oversee its own government's accounting practices or the standards set by the Federal Accounting Standards Advisory Board. The on- or off-balance sheet obligations of those two independent GSEs was just over $5 trillion at the time the conservatorship was put in place, consisting mainly of mortgage payment guarantees and agency bonds.[28] The confusing independent but government-controlled status of the GSEs resulted in investors of the legacy common shares and preferred shares launching various activist campaigns in 2014.[29]
Guaranteed obligations excluded
U.S. federal government guarantees were not included in the public debt total as they were not drawn against.[clarification needed] In late 2008, the federal government had guaranteed large amounts of obligations of mutual funds, banks, and corporations under several programs designed to deal with the problems arising from the late-2000s financial crisis. The guarantee program lapsed at the end of 2012, when Congress declined to extend the scheme. The funding of direct investments made in response to the crisis, such as those made under the Troubled Asset Relief Program, was included in the debt totals.
Unfunded obligations excluded

The U.S. federal government is obligated under current law to make mandatory payments for programs such as Medicare, Medicaid and Social Security. The Government Accountability Office (GAO) projects that payouts for these programs will significantly exceed tax revenues over the next 75 years. The Medicare Part A (hospital insurance) payouts already exceed program tax revenues, and social security payouts exceeded payroll taxes in fiscal year 2010. These deficits require funding from other tax sources or borrowing.[30] The present value of these deficits or unfunded obligations is an estimated $45.8 trillion. This is the amount that would have had to be set aside in 2009 in order to pay for the unfunded obligations which, under current law, will have to be raised by the government in the future. Approximately $7.7 trillion relates to Social Security, while $38.2 trillion relates to Medicare and Medicaid. In other words, health care programs will require nearly five times more funding than Social Security. Adding this to the national debt and other federal obligations would bring total obligations to nearly $62 trillion.[31] However, these unfunded obligations are not counted in the national debt, as shown in monthly Treasury reports of the national debt.[32]
Measuring debt burden
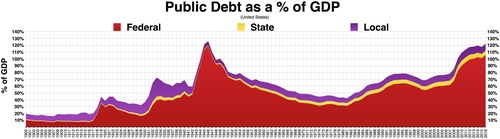
Federal, State, and Local debt and a percentage of GDP chart/graph
GDP is a measure of the total size and output of the economy. One measure of the debt burden is its size relative to GDP, called the "debt-to-GDP ratio". Mathematically, this is the debt divided by the GDP amount. The Congressional Budget Office includes historical budget and debt tables along with its annual "Budget and Economic Outlook". Debt held by the public as a percentage of GDP rose from 34.7% GDP in 2000 to 40.5% in 2008 and 67.7% in 2011.[33] Mathematically, the ratio can decrease even while debt grows if the rate of increase in GDP (which also takes account of inflation) is higher than the rate of increase of debt. Conversely, the debt to GDP ratio can increase even while debt is being reduced, if the decline in GDP is sufficient.
According to the CIA World Factbook, during 2015, the U.S. debt to GDP ratio of 73.6% was the 39th highest in the world. This was measured using "debt held by the public."[34] However, $1 trillion in additional borrowing since the end of FY 2015 raised the ratio to 76.2% as of April 2016 . Also, this number excludes state and local debt. According to the OECD, general government gross debt (federal, state, and local) in the United States in the fourth quarter of 2015 was $22.5 trillion (125% of GDP); subtracting out $5.25 trillion for intragovernmental federal debt to count only federal "debt held by the public" gives 96% of GDP.[35]
The ratio is higher if the total national debt is used, by adding the "intragovernmental debt" to the "debt held by the public." For example, on April 29, 2016, debt held by the public was approximately $13.84 trillion (~$17.2 trillion in 2023) or about 76% of GDP. Intra-governmental holdings stood at $5.35 trillion, giving a combined total public debt of $19.19 trillion. U.S. GDP for the previous 12 months was approximately $18.15 trillion, for a total debt to GDP ratio of approximately 106%.[36]
Calculating the annual change in debt

Conceptually, an annual deficit (or surplus) should represent the change in the national debt, with a deficit adding to the national debt and a surplus reducing it. However, there is complexity in the budgetary computations that can make the deficit figure commonly reported in the media (the "total deficit") considerably different from the annual increase in the debt. The major categories of differences are the treatment of the Social Security program, Treasury borrowing, and supplemental appropriations outside the budget process.[37]
Social Security payroll taxes and benefit payments, along with the net balance of the U.S. Postal Service, are considered "off-budget", while most other expenditure and receipt categories are considered "on-budget". The total federal deficit is the sum of the on-budget deficit (or surplus) and the off-budget deficit (or surplus). Since FY1960, the federal government has run on-budget deficits except for FY1999 and FY2000, and total federal deficits except in FY1969 and FY1998–FY2001.[38]
For example, in January 2009 the CBO reported that for FY2008, the "on-budget deficit" was $638 billion, offset by an "off-budget surplus" (mainly due to Social Security revenue in excess of payouts) of $183 billion, for a "total deficit" of $455 billion. This latter figure is the one commonly reported in the media. However, an additional $313 billion was required for "the Treasury actions aimed at stabilizing the financial markets," an unusually high amount because of the subprime mortgage crisis. This meant that the "debt held by the public" increased by $768 billion ($455B + $313B = $768B). The "off-budget surplus" was borrowed and spent (as is typically the case), increasing the "intra-governmental debt" by $183 billion. So the total increase in the "national debt" in FY2008 was $768B +$183B = $951 billion.[37] The Treasury Department reported an increase in the national debt of $1,017B for FY2008.[39] The $66 billion difference is likely from "supplemental appropriations" for the War on Terror, some of which were outside the budget process entirely until President Obama began including most of them in his FY2010 budget.[40]
In other words, spending the "off budget" Social Security surplus adds to the total national debt (by increasing the intragovernmental debt) while the "off-budget" surplus reduces the "total" deficit reported in the media. Certain spending called "supplemental appropriations" is outside the budget process entirely but adds to the national debt. Funding for the Iraq and Afghanistan wars was accounted for this way prior to the Obama administration.[40] Certain stimulus measures and earmarks were also outside the budget process. The federal government publishes the total debt owed (public and intragovernmental holdings) daily.[41]
Holders of debt


Because a large variety of people own the notes, bills, and bonds in the "public" portion of the debt, the Treasury also publishes information that groups the types of holders by general categories to portray who owns United States debt. In this data set, some of the public portion is moved and combined with the total government portion, because this amount is owned by the Federal Reserve as part of United States monetary policy. (See Federal Reserve System.)
As is apparent from the chart, a little less than half of the total national debt is owed to the "Federal Reserve and intragovernmental holdings". The foreign and international holders of the debt are also put together from the notes, bills, and bonds sections. To the right is a chart for the data as of June 2008:
Foreign holdings


April 2021 - April 2022
As of October 2018, foreigners owned $6.2 trillion of U.S. debt, or approximately 39% of the debt held by the public of $16.1 trillion and 28% of the total debt of $21.8 trillion.[42] In December 2020, foreigners held 33% ($7 trillion out of $21.6 trillion) of publicly held US debt; of this $7 trillion, $4.1 trillion (59.2%) belonged to foreign governments and $2.8 trillion (40.8%) to foreign investors. Including both private and public debt holders, the top three December 2020 national holders of American public debt are Japan ($1.2 trillion or 17.7%), China ($1.1 trillion or 15.2%), and the United Kingdom ($0.4 trillion or 6.2%).[43]
Historically, the share held by foreign governments had grown over time, rising from 13% of the public debt in 1988[44] to 34% in 2015.[45] In more recent years, foreign ownership has retreated both in percent of total debt and total dollar amounts. China's maximum holding of 9.1% or $1.3 trillion of U.S. debt occurred in 2011, subsequently reduced to 5% in 2018. Japan's maximum holding of 7% or $1.2 trillion occurred in 2012, subsequently reduced to 4% in 2018.[46]

According to Paul Krugman, "America actually earns more from its assets abroad than it pays to foreign investors."[47] Nonetheless, the country's net international investment position represents a debt of more than $9 trillion.[48]
Forecast

CBO ten-year outlook 2018–2028 (pre–COVID-19 pandemic)
The CBO estimated the impact of the Tax Cuts and Jobs Act and separate spending legislation over the 2018–2028 period in their annual "Budget & Economic Outlook", released in April 2018:
- The budget deficit in fiscal 2018 (which runs from October 1, 2017, to September 30, 2018, the first year budgeted by President Trump) is forecast to be $804 billion, an increase of $139 billion (21%) from the $665 billion in 2017 and up $242 billion (39%) over the previous baseline forecast (June 2017) of $580 billion for 2018. The June 2017 forecast was essentially the budget trajectory inherited from President Obama; it was prepared prior to the Tax Act and spending increases under President Trump.
- For the 2018–2027 period, CBO projects the sum of the annual deficits (i.e., debt increase) to be $11.7 trillion, an increase of $1.6 trillion (16%) over the previous baseline (June 2017) forecast of $10.1 trillion.
- The $1.6 trillion debt increase includes three main elements:
- $1.7 trillion less in revenues due to the tax cuts;
- $1.0 trillion more in spending; and
- Partially offsetting incremental revenue of $1.1 trillion due to higher economic growth than previously forecast.
- Debt held by the public is expected (Congressional Budget Office Outlook) to rise from 78% of GDP ($16 trillion) at the end of 2018 to 96% GDP ($29 trillion) by 2028. That would be the highest level since the end of World War II.[citation needed]
- CBO estimated under an alternative scenario (in which policies in place as of April 2018 are maintained beyond scheduled initiation or expiration) that deficits would be considerably higher, rising by $13.7 trillion over the 2018–2027 period, an increase of $3.6 trillion over the June 2017 baseline forecast. Maintaining current policies for example would include extending the individual Trump tax cuts past their scheduled expiration in 2025, among other changes.
- The debt increase of $1.6 trillion represents approximately $12,700 per household (assuming 126.2 million households in 2017), while the $3.6 trillion represents $28,500 per household.[21]
CBO ten-year outlook 2020–2030 (during the COVID-19 pandemic)
The CBO estimated that the budget deficit for fiscal year 2020 would increase to $3.3 trillion or 16% GDP, more than triple that of 2019 and the largest as % GDP since 1945, because of the impact of the COVID-19 pandemic. CBO also forecast the debt held by the public would rise to 98% GDP in 2020, compared with 79% in 2019 and 35% in 2007 before the Great Recession.[12]
CBO long-term outlook


The CBO reports its Long-Term Budget Outlook annually, providing at least two scenarios for spending, revenue, deficits, and debt. The 2019 Outlook mainly covers the 30-year period through 2049. The CBO reported:
Large budget deficits over the next 30 years are projected to drive federal debt held by the public to unprecedented levels—from 78 percent of gross domestic product (GDP) in 2019 to 144 percent by 2049. That projection incorporates CBO's central estimates of various factors, such as productivity growth and interest rates on federal debt. CBO's analysis indicates that even if values for those factors differed from the agency's projections, debt several decades from now would probably be much higher than it is today.[49]
Furthermore, under alternative scenarios:
If lawmakers changed current laws to maintain certain major policies now in place—most significantly, if they prevented a cut in discretionary spending in 2020 and an increase in individual income taxes in 2026—then debt held by the public would increase even more, reaching 219 percent of GDP by 2049. By contrast, if Social Security benefits were limited to the amounts payable from revenues received by the Social Security trust funds, debt in 2049 would reach 106 percent of GDP, still well above its current level.
Over the long-term, the CBO projects that interest expense and mandatory spending categories (e.g., Medicare, Medicaid and Social Security) will continue to grow relative to GDP, while discretionary categories (e.g., Defense and other Cabinet Departments) continue to fall relative to GDP. Debt is projected to continue rising relative to GDP under the above two scenarios, although the CBO did also offer other scenarios that involved austerity measures that would bring the debt to GDP ratio down.[49]
Ways to reduce debt
Negative real interest rates
Since 2010, the U.S. Treasury has been obtaining negative real interest rates on government debt, meaning the inflation rate is greater than the interest rate paid on the debt.[50] Such low rates, outpaced by the inflation rate, occur when the market believes that there are no alternatives with sufficiently low risk, or when popular institutional investments such as insurance companies, pensions, or bond, money market, and balanced mutual funds are required or choose to invest sufficiently large sums in Treasury securities to hedge against risk.[51][52] Economist Lawrence Summers states that at such low interest rates, government borrowing actually saves taxpayer money and improves creditworthiness.[53]
In the late 1940s through the early 1970s, the U.S. and UK both reduced their debt burden by about 30% to 40% of GDP per decade by taking advantage of negative real interest rates, but there is no guarantee that government debt rates will continue to stay this low.[51][54] Between 1946 and 1974, the U.S. debt-to-GDP ratio fell from 121% to 32% even though there were surpluses in only eight of those years which were much smaller than the deficits.[55]
Raising reserve requirements and full reserve banking
Two economists, Jaromir Benes and Michael Kumhof, working for the International Monetary Fund, published a working paper called The Chicago Plan Revisited suggesting that the debt could be eliminated by raising bank reserve requirements and converting from fractional-reserve banking to full-reserve banking.[56][57] Economists at the Paris School of Economics have commented on the plan, stating that it is already the status quo for coinage currency,[58] and a Norges Bank economist has examined the proposal in the context of considering the finance industry as part of the real economy.[59] A Centre for Economic Policy Research paper agrees with the conclusion that "no real liability is created by new fiat money creation and therefore public debt does not rise as a result."[60]
Risks and debates

CBO risk factors
The CBO reported several types of risk factors related to rising debt levels in a July 2010 publication:
- A growing portion of savings would go towards purchases of government debt, rather than investments in productive capital goods such as factories and computers, leading to lower output and incomes than would otherwise occur;
- If higher marginal tax rates were used to pay rising interest costs, savings would be reduced and work would be discouraged;
- Rising interest costs would force reductions in government programs;
- Restrictions to the ability of policymakers to use fiscal policy to respond to economic challenges; and
- An increased risk of a sudden fiscal crisis, in which investors demand higher interest rates.[61]
Credit default
The U.S. has never fully defaulted.[62][63] In April 1979, however, the U.S. may have technically defaulted on $122 million (~$413 million in 2023) in Treasury bills, which was less than 1% of U.S. debt. The Treasury Department characterized it as a delay rather than as a default, but it did have consequences for short-term interest rates, which jumped 0.6%.[64] Others view it as a temporary, partial default.[65][66][67]
Debt ceiling
The United States debt ceiling is a legislative constraint on the amount of national debt that can be incurred by the U.S. Treasury. It limits how much money the federal government may pay on the debt it already has by borrowing even more money. The debt ceiling applies to almost all federal debt, including accounts owned by the public and intra-government funds for Medicare and Social Security.[68][69]
Sustainabilityedit
In 2009 the Government Accountability Office (GAO) reported that the United States was on a "fiscally unsustainable" path because of projected future increases in Medicare and Social Security spending.[30] According to the Treasury report in October 2018, summarized by Business Insider's Bob Bryan, the U.S. federal budget deficit rose as a result of the Tax Cuts and Jobs Act of 2017[15] signed into law by President Donald Trump on December 22, 2017[70] and the Consolidated Appropriations Act, 2018 signed into law on March 23, 2018.[71][72]
Risks to economic growthedit
Debt levels may affect economic growth rates. In 2010, economists Kenneth Rogoff and Carmen Reinhart reported that among the 20 developed countries studied, average annual GDP growth was 3–4% when debt was relatively moderate or low (i.e., under 60% of GDP), but it dips to just 1.6% when debt was high (i.e., above 90% of GDP).[73] In April 2013, the conclusions of Rogoff and Reinhart's study came into question when a coding error in their original paper was discovered by Herndon, Ash and Pollin of the University of Massachusetts Amherst.[74][75] Herndon, Ash and Pollin found that after correcting for errors and unorthodox methods used, there was no evidence that debt above a specific threshold reduces growth.[76] Reinhart and Rogoff maintain that after correcting for errors, a negative relationship between high debt and growth remains.[77] However, other economists, including Paul Krugman, have argued that it is low growth which causes national debt to increase, rather than the other way around.[78][79][80]
Commenting on fiscal sustainability, former Federal Reserve Chairman Ben Bernanke stated in April 2010 that "Neither experience nor economic theory clearly indicates the threshold at which government debt begins to endanger prosperity and economic stability. But given the significant costs and risks associated with a rapidly rising federal debt, our nation should soon put in place a credible plan for reducing deficits to sustainable levels over time."[81]
Interest and debt service costsedit


Interest expense on the public debt was approximately $678 billion in FY2023. During FY2023, the government also accrued a non-cash interest expense of $197 billion for intra-governmental debt, primarily the Social Security Trust Fund, for a total interest expense of $875 billion. This accrued interest is added to the Social Security Trust Fund and therefore the national debt each year and will be paid to Social Security recipients in the future. However, since it is a non-cash expense it is excluded from the budget deficit calculation.[82]
The federal debt at the end of the 2018/19 fiscal year (ended September 30, 2019) was $22.7 trillion (~$27.1 trillion in 2023). The portion that is held by the public was $16.8 trillion. Neither figure includes approximately $2.5 trillion owed to the government.[83] Interest on the debt was $404 billion.[84]
The cost of servicing the U.S. national debt can be measured in various ways. The CBO analyzes net interest as a percentage of GDP, with a higher percentage indicating a higher interest payment burden. During 2015, this was 1.3% GDP, close to the record low 1.2% of the 1966–1968 era. The average from 1966 to 2015 was 2.0% of GDP.[85] However, the CBO estimated in 2016 that the interest amounts and % GDP will increase significantly over the following decade as both interest rates and debt levels rise: "Interest payments on that debt represent a large and rapidly growing expense of the federal government. CBO's baseline shows net interest payments more than tripling under current law, climbing from $231 billion in 2014, or 1.3% of GDP, to $799 billion in 2024, or 3.0% of GDP—the highest ratio since 1996."[86]
According to a study by the Committee for a Responsible Federal Budget (CRFB), the U.S. government will spend more on servicing their debts than they do for their national defense budget by 2024.[87]
In October 2023, yields for 10-year Treasury notes breached 5% as traders adjusted their assessment of United States' fiscal position and lowered their expectation that Congress or the White House would take any action to improve it. The impact was felt by homebuyers, with 30-year mortgage rate at its highest in two decades, and corporations facing higher costs of borrowing. Interests paid by the federal government jumped by $184 billion during the 2022 fiscal year and are still climbing.[88]
Recent US debt service/interest statisticsedit
| FY | GAO: (Total) Debt Service (in billion dollars) | FRED: (Total) Debt Service (in billion dollars)1 | GAO: (Publicly-held) Debt Service (in billion dollars) | FRED: Fed Receipts (in billion dollars)2 | FRED: Debt Service/Receipts |
|---|---|---|---|---|---|
| 2023 | 875.5[89] | 981[90] | 678[89] | 4439 | 22% |
| 2022 | 723.6[89] | 829.6 | 496.5[89] | 4896 | 17% |
| 2021 | 575[91] | 612 | 392[92] | 4047 | 15% |
| 2020 | 527[92] | 517.7 | 371[92][93] | 3421 | 15% |
| 2019 | 574[93] | 564.5 | 404[93] | 3463 | 16% |
| 2018 | 528.4[94] | 571 | 357[94] | 3330 | 17% |
| 2017 | 456.7[94] | 493 | 296[94] | 3316 | 15% |
| 2016 | 430[95] | 460 | 273[95] | 3268 | 14% |
| 2015 | 407[95] | 434.7 | 251[95] | 3250 | 13% |
| 2014 | 433[96] | 442 | 260[96] | 3021 | 15% |
| 2013 | 425[96] | 425 | 247.6[96] | 2775 | 15% |
| 2012 | 432[97] | 417 | 245.4[97] | 2450 | 17% |
| 2011 | 453.6[97] | 433 | 250.9[97] | 2303 | 19% |
| 2010 | 413[98] | 399.5 | 215[98] | 2162.7 | 18% |