

A | B | C | D | E | F | G | H | CH | I | J | K | L | M | N | O | P | Q | R | S | T | U | V | W | X | Y | Z | 0 | 1 | 2 | 3 | 4 | 5 | 6 | 7 | 8 | 9
| Part of a series on the |
| COVID-19 pandemic in the United Kingdom, British Overseas Territories and Crown Dependencies |
|---|
 |
| (Part of the global COVID-19 pandemic) |
This article presents official statistics gathered during the COVID-19 pandemic in the United Kingdom.
The official daily report from the Department of Health and Social Care (DHSC) counts those who died within 28 days of testing positive for coronavirus. It "could be the major cause, a contributory factor or simply present when they are dying of something else".[1] From 29 April 2020, the official figures include all coronavirus-positive deaths in the UK, wherever they happened.[2] Before then, the official daily toll included only hospital deaths in England, but included all coronavirus-positive deaths in the rest of the UK wherever they happened, if known to public health agencies.[3][4] There may be a delay between a death and it entering official statistics so families can be informed; this delay is usually a few days, but can be longer.[5][6]
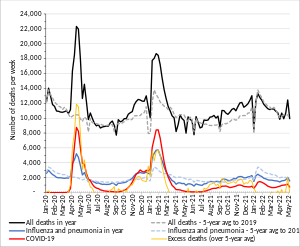
The Office for National Statistics (ONS) issues a weekly report covering the four countries, which counts all deaths where coronavirus was mentioned on the death certificate; not necessarily as the main cause of death. As of 21 September 2021[update], the total of registered deaths mentioning COVID-19 up till 10 September was 160,374, comprising 146,380 deaths for England, 8,129 for Wales, 10,688 for Scotland and 3,306 for Northern Ireland. In addition 184 non-UK residents died in England and Wales.[7][needs update] This incorporates data from the National Records of Scotland and Northern Ireland Statistics and Research Agency. This figure is higher because it also counts deaths where no test was done.[3][4][8] The ONS has analysed death certificates for England and Wales to the end of 2020 and shown that 91% of deaths which mention COVID-19 state this as the main cause of death (compared with 18% for flu and pneumonia).[9] The end of free mass testing in April 2022 greatly reduced the number of tests taken and may affect the number of cases, although ONS statistics have continued being collected.[10]
Details
As of 5 June 2020[update] the death rate across the UK from COVID-19 was 592 per million population.[11] The death rate varied greatly by age and healthiness. More than 90% of deaths were among the most vulnerable: those with underlying illnesses and the over-60s.[12][13][14] COVID-19 deaths are "remarkably uncommon" among the least vulnerable: those under 65 and with no underlying illnesses.[15]
There was also large regional variation in the pandemic's severity. The outbreak in London had the highest number and highest rate of infections.[16] England was the UK country with the highest recorded death rate per capita, followed by Wales and then Scotland, while Northern Ireland has the lowest per capita.[17]
On 22 April 2020, the Financial Times estimated that 41,000 may have died by that date, by extrapolating the ONS data and counting all deaths above the average for the time of year.[18] The World Health Organisation cautioned on 23 April that up to half of coronavirus deaths in Europe were among care home residents. The Chief Medical Officer for England warned that even the ONS figures on coronavirus deaths in care homes are likely to be "an underestimate" and said he is "sure we will see a high mortality rate sadly in care homes, because this is a very, very vulnerable group".[19][20][18] On 28 April, Health Secretary Matt Hancock said the number of coronavirus-linked deaths in care homes would be announced as part of the daily report, instead of weekly.[21] By 7 May 2020, the epidemic was concentrated in hospitals and care homes, with the infection rate being higher in care homes than in the community.[22][23] By 28 May, the Financial Times estimate of 'excess deaths', the increase over the figure expected for the time of year, had increased to 59,537 since 20 March.[24]
The Guardian wrote in May 2020 that across the UK around 8,000 more people had died in their homes since the start of the pandemic, when compared to normal times. Of that total around 80% of the people according to their death certificates, died from non COVID-19 illnesses. The statistics additionally showed a drop in non COVID-19 deaths in hospitals, leading many to think that people who normally would have been admitted were avoiding hospitals.[25] NHS England said that between 10 and 20% of people who were admitted to hospital for other reasons contracted coronavirus during their stay.[26]
The number of cases in the table represent laboratory confirmed cases only. The UK Government's Chief Scientific Adviser Patrick Vallance, says it is likely that other cases are not included in these figures.[27]
In the week ending 19 June 2020, registered deaths fell below the average for the previous five years for the first time since mid-March.[28] The total number of excess deaths in the UK since the start of the outbreak is just over 65,000.[28]
On 12 August 2020, the UK death toll was reduced by more than 5,000, after a review of how deaths are counted in England.[29]
In the latter half of August, testing increased from 2.3 to 2.6 tests per thousand population per day.[30]
2,460 new cases in the UK were reported on Tuesday 8 September 2020.[31] This number was approximately double what it had been a fortnight previously[32] and the daily case number further doubled to 4,926 a fortnight later, on 22 September 2020.[32] On 18 September, the COVID Symptom Study estimated the value to be above 1 in each of England, Scotland and Wales, with a value of 1.4 for England meaning that cases were doubling every seven days.[33]

-
 Graph showing the number of COVID-19 cases and deaths in the United Kingdom, logarithmic scale on y-axis
 -
 Graph comparing active UK cases to the most affected countries, per 100,000 population
 -
 Graph of weekly England and Wales death data from the Office for National Statistics including COVID-19 deaths[7]


Total cases and deaths
This section needs to be updated. (August 2021) |
Graphs are unavailable due to technical issues. There is more info on Phabricator and on MediaWiki.org. |
Graphs are unavailable due to technical issues. There is more info on Phabricator and on MediaWiki.org. |
Long Covid
Roughly 1.3 million UK people have "long Covid", symptoms lasting over four weeks following initial infection, according to an Office for National Statistics survey.
The ONS survey, during four weeks in November and December 2021, claims, of those with long Covid:
- "51% have fatigue
- 37% have loss of smell
- 36% have shortness of breath
- 28% have difficulty concentrating"
As with previous analyses, roughly 20% said "their symptoms meant their ability to do day-to-day activities had been limited a lot."
And patients most likely to develop long Covid are:
- "women
- 35- to 69-year-olds
- people with underlying conditions
- those working in health, social care and education"
Dr David Strain of the University of Exeter said, "The stark warning here is that, based on this, in the previous waves, over 800,000 people have their day-to-day activities significantly affected over three months after catching Covid and nearly a quarter of a million report this has a dramatic impact on their quality of life. As we continue to see case numbers of Omicron rise, we must be wary that our reliance purely on hospitalisations and death as a measure of the risk from Covid could grossly underestimate the public-health impact of our current Covid strategy."[34]
New cases
New cases by day reported
The figures are as reported daily at coronavirus.data.gov.uk.[35] From the week of 21 February 2022, the UK Health Security Agency stopped publishing dashboard updates at weekends. Figures for Saturday and Sunday are now combined with Monday's figures. The source stopped reporting numbers after May 2022.[36]
Daily cases, 2022 (NB scaled to a maximum of 240,000 per time period)
Graphs are unavailable due to technical issues. There is more info on Phabricator and on MediaWiki.org. |
Daily cases, 2021 (NB scaled to a maximum of 200,000 per day)
Graphs are unavailable due to technical issues. There is more info on Phabricator and on MediaWiki.org. |
Daily cases, 2020 (NB scaled to a maximum of 60,000 per day)
Graphs are unavailable due to technical issues. There is more info on Phabricator and on MediaWiki.org. |
Notes
- Values for dates between 25 September and 1 October 2020 are questionable in light of announcements of 3 and 4 October: Following under-reporting due to a 'technical issue' between 25 September and 1 October, 15,841 additional cases were reported on 3 and 4 October. The error was caused by a limit on the number of columns in an Excel spreadsheet.
- Values for dates between 8 and 16 December 2020 are questionable in light of announcement of 16 December: Public Health Wales announced that there had been a delay in transferring data from the Lighthouse Labs which had resulted in under-reporting over the preceding week of approximately 11,000 positive tests. The 'missing' numbers were reported instead on 16 December.[37]
- Warning: the values in the above graph are not directly comparable between different time periods because they were measured under different testing rates. It is therefore vital to consult Test positivity rate and New daily tests, and to understand the strategy for selection of subjects for testing.
Details of the periods with corrected case numbers
On 3 October, the UK Government Dashboard "GOV.UKCoronavirus (COVID-19) in the UK" issued the following note:
Due to a technical issue, which has now been resolved, there has been a delay in publishing a number of COVID-19 cases to the dashboard in England. This means the total reported over the coming days will include some additional cases from the period between 24 September and 1 October, increasing the number of cases reported.
On 4 October, the UK Government Dashboard "GOV.UKCoronavirus (COVID-19) in the UK" issued the following note:
An issue was identified overnight on Friday 2 October in the automated process that transfers positive cases data to PHE. It has now been resolved. The cases by publish date for 3 and 4 October include 15,841 additional cases with specimen dates between 25 September and 2 October — they are therefore artificially high for England and the UK.
After correction as calculated by the BBC,[38] the case numbers should read from 25 September as below, showing a trend (apart from the 28 September and 4 October figures) which is subsequently maintained:
| Date | 25-Sep | 26-Sep | 27-Sep | 28-Sep | 29-Sep | 30-Sep | 1-Oct | 2-Oct | 3-Oct | 4-Oct | 5-Oct | 6-Oct |
|---|---|---|---|---|---|---|---|---|---|---|---|---|
| Original | 6874 | 6042 | 5693 | 4044 | 7143 | 7108 | 6914 | 6968 | 12872 | 22961 | 12594 | 14542 |
| Adjustment | 957 | 744 | 757 | 0 | 1415 | 3049 | 4133 | 4786 | 0 | -15841 | 0 | 0 |
| Adjusted Total | 7831 | 6786 | 6450 | 4044 | 8558 | 10157 | 11047 | 11754 | 12872 | 7120 | 12594 | 14542 |
On 16 December Public Health Wales announced that there had been a delay in transferring data from the Lighthouse Labs which had resulted in under-reporting over the preceding week of approximately 11,000 positive tests. The 'missing' numbers were reported instead on 16 December. While the Wales numbers were a relatively small proportion of the UK total, this nevertheless affected the day-to-day accuracy of the case numbers in this period, though not the cumulative totals afterwards: the affected dates are marked in the graph above with a letter 'x'.[39]
New cases by week reported
Number of people who have had a lab-confirmed positive test result[40] From the week of 21 February 2022, the UK Health Security Agency stopped publishing dashboard updates at weekends. Figures for Saturday and Sunday are now combined with Monday's figures. Hence, the period displayed beginning 20 February 2022 contains only six days figures after which full seven day totals will commence with the period commencing 26 February 2022. Easter 2022 dates necessarily contain a 6-day and an 8-day period.
By week (2022)
Graphs are unavailable due to technical issues. There is more info on Phabricator and on MediaWiki.org. |
By week (2020-2021)
Graphs are unavailable due to technical issues. There is more info on Phabricator and on MediaWiki.org. |
' * ' Values for these dates are questionable in light of the announcements of 3 & 4 October, see New cases by day reported
The values in the above graph are not directly comparable between different time periods because they were measured under different testing rates. It is therefore vital to consult Test positivity rate and New daily tests.
Numbers of deaths
New deaths by week and day reported
Deaths of people within 28 days of a positive test result[nb 1][41]
By week (2022) NB Scaled to maximum of 2,000
Graphs are unavailable due to technical issues. There is more info on Phabricator and on MediaWiki.org. |
By week (2020-2021) NB Scaled to maximum of 9,000
Graphs are unavailable due to technical issues. There is more info on Phabricator and on MediaWiki.org. |
Daily numbers (2022) - scaled with a maximum of 600 per day
From the week of 21 February 2022, the UK Health Security Agency stopped publishing dashboard updates at weekends. Figures for Saturday and Sunday are now combined with Monday's figures.
Graphs are unavailable due to technical issues. There is more info on Phabricator and on MediaWiki.org. |
Daily numbers (2021) - scaled with a maximum of 2,000 per day
Graphs are unavailable due to technical issues. There is more info on Phabricator and on MediaWiki.org. |
Daily numbers (2020) - scaled with a maximum of 1,200 per day
Graphs are unavailable due to technical issues. There is more info on Phabricator and on MediaWiki.org. |
Daily deaths within 28 days of positive test, listed by date reported
Graphs are unavailable due to technical issues. There is more info on Phabricator and on MediaWiki.org. |
Daily number of deaths within 28 days of positive test, by date of death.[42]
| Deaths within 28 days of positive test by date reported, March - October 2020 | |||||
|---|---|---|---|---|---|
| Date | England [nb 2] | Northern Ireland [nb 3] |
Scotland [nb 4] | Wales [nb 5] | United Kingdom |
| 6 Mar | 1 | 0 | 0 | 0 | 1 |
| 7 Mar | 1 | 0 | 0 | 0 | 1 |
| 8 Mar | 0 | 0 | 0 | 0 | 0 |
| 9 Mar | 1 | 0 | 0 | 0 | 1 |
| 10 Mar | 4 | 0 | 0 | 0 | 4 |
| 11 Mar | 0 | 0 | 0 | 0 | 0 |
| 12 Mar | 2 | 0 | 0 | 0 | 2 |
| 13 Mar | 1 | 0 | 0 | 0 | 1 |
| 14 Mar | 18 | 0 | 0 | 0 | 18 |
| 15 Mar | 14 | 0 | 0 | 0 | 14 |
| 16 Mar | 22 | 0 | 0 | 0 | 22 |
| 17 Mar | 15 | 0 | 1 | 0 | 16 |
| 18 Mar | 33 | 0 | 1 | 0 | 34 |
| 19 Mar | 42 | 0 | 3 | 0 | 45 |
| 20 Mar | 32 | 0 | 0 | 0 | 32 |
| 21 Mar | 54 | 1 | 1 | 2 | 58 |
| 22 Mar | 24 | 0 | 3 | 9 | 36 |
| 23 Mar | 67 | 1 | 4 | 4 | 76 |
| 24 Mar | 143 | 2 | 2 | 1 | 148 |
| 25 Mar | 178 | 2 | 6 | 5 | 191 |
| 26 Mar | 169 | 3 | 3 | 6 | 181 |
| 27 Mar | 271 | 3 | 8 | 6 | Zdroj:https://en.wikipedia.org?pojem=Statistics_of_the_COVID-19_pandemic_in_the_United_Kingdom|