A | B | C | D | E | F | G | H | CH | I | J | K | L | M | N | O | P | Q | R | S | T | U | V | W | X | Y | Z | 0 | 1 | 2 | 3 | 4 | 5 | 6 | 7 | 8 | 9
This article needs additional citations for verification. (February 2022) |
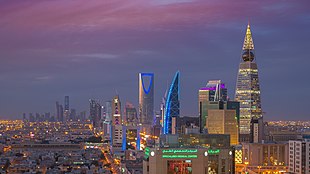
 Riyadh, the financial center of Saudi Arabia | |
| Currency | Saudi Riyal (SAR)[a] |
|---|---|
| Calendar year | |
Trade organisations | WTO, OPEC, and GCC |
Country group |
|
| Statistics | |
| Population | |
| GDP | |
| GDP rank | 19th (nominal, 2024) 17th (PPP, 2024) |
GDP growth | |
GDP per capita | |
GDP per capita rank | 35th (nominal, 2024) 15th (PPP, 2024) |
GDP by sector | (2017 est.)[7]
|
| 1.6% (2024)[8] | |
| 45.9 high (2013 est.)[7] | |
Labour force | 13.8 million (2017 est.)[7] |
Labour force by occupation | (2005 est.)[7]
|
| Unemployment | |
Main industries | |
| External | |
| Exports | |
Export goods | crude petroleum, refined petroleum, polymers, industrial alcohols, natural gas (2019)[7] |
Main export partners |
|
| Imports | $213.0 billion (2021 est.)[7] |
Import goods | machinery and equipment, chemicals, packaged medicine, motor vehicles, textiles, broadcasting equipment, telephones[7] |
Main import partners |
|
Gross external debt | |
| Public finances | |
| 8.9% (of GDP) (2017 est.)[7] | |
| Revenues | 181 billion (2017 est.)[7] |
| Expenses | 241.8 billion (2017 est.)[7] |
All values, unless otherwise stated, are in US dollars. | |
The economy of Saudi Arabia is the second-largest in the Middle East and the nineteenth-largest in the world.[6] The Saudi economy is highly reliant on its petroleum sector. Oil accounts on average in recent years for approximately 40% of Saudi GDP and 75% of fiscal revenue, with substantial fluctuations depending on oil prices each year.[14]
The kingdom has the second-largest proven petroleum reserves,[15] and the fourth-largest measured natural gas reserves.[16] Saudi Arabia is currently the largest exporter of petroleum in the world.[17] Other major parts of the economy include refining and chemical manufacturing from the oil reserves, much of which is vertically integrated in the state-owned enterprise, Saudi Aramco. Saudi Arabia is permanent and founding member of OPEC
In 2016, the Saudi government launched its Saudi Vision 2030 program to reduce its dependency on oil and diversify its economic resources.[18] By 2022, Saudi Arabia had only modestly reduced its dependence on oil.[14]
Monetary policy in Saudi Arabia is anchored by the fixed exchange rate of the Saudi Riyal to the U.S. Dollar.[19]
Economic overview
The following table shows the main economic indicators in 1980–2021 (with IMF staff estimates in 2022–2027). Inflation under 5% is in green.[20][21]
| Year | GDP
(in billion US$ PPP) |
GDP per capita
(in US$ PPP) |
GDP
(in billion US$ nominal) |
GDP per capita
(in US$ nominal) |
GDP growth
(real) |
Inflation rate
(in percent) |
Unemployment
(in percent) |
Gov. debt
(in % of GDP) |
|---|---|---|---|---|---|---|---|---|
| 1980 | 418.1 | 44,859.5 | 164.5 | 17,655.1 | n/a | n/a | ||
| 1981 | n/a | n/a | ||||||
| 1982 | n/a | n/a | ||||||
| 1983 | n/a | n/a | ||||||
| 1984 | n/a | n/a | ||||||
| 1985 | n/a | n/a | ||||||
| 1986 | n/a | n/a | ||||||
| 1987 | n/a | n/a | ||||||
| 1988 | n/a | n/a | ||||||
| 1989 | n/a | n/a | ||||||
| 1990 | n/a | n/a | ||||||
| 1991 | n/a | 39.4% | ||||||
| 1992 | n/a | |||||||
| 1993 | n/a | |||||||
| 1994 | n/a | |||||||
| 1995 | n/a | |||||||
| 1996 | n/a | |||||||
| 1997 |
