A | B | C | D | E | F | G | H | CH | I | J | K | L | M | N | O | P | Q | R | S | T | U | V | W | X | Y | Z | 0 | 1 | 2 | 3 | 4 | 5 | 6 | 7 | 8 | 9
| Mathematical analysis → Complex analysis |
| Complex analysis |
|---|
 |
| Complex numbers |
| Complex functions |
| Basic theory |
| Geometric function theory |
| People |
In mathematics, the complex plane is the plane formed by the complex numbers, with a Cartesian coordinate system such that the horizontal x-axis, called the real axis, is formed by the real numbers, and the vertical y-axis, called the imaginary axis, is formed by the imaginary numbers.
The complex plane allows for a geometric interpretation of complex numbers. Under addition, they add like vectors. The multiplication of two complex numbers can be expressed more easily in polar coordinates—the magnitude or modulus of the product is the product of the two absolute values, or moduli, and the angle or argument of the product is the sum of the two angles, or arguments. In particular, multiplication by a complex number of modulus 1 acts as a rotation.
The complex plane is sometimes called the Argand plane or Gauss plane.
Notational conventions
Complex numbers
In complex analysis, the complex numbers are customarily represented by the symbol z, which can be separated into its real (x) and imaginary (y) parts:
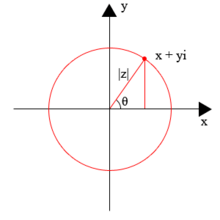
for example: z = 4 + 5i, where x and y are real numbers, and i is the imaginary unit. In this customary notation the complex number z corresponds to the point (x, y) in the Cartesian plane; the point (x, y) can also be represented in polar coordinates with:
In the Cartesian plane it may be assumed that the range of the arctangent function takes the values (−π/2, π/2) (in radians), and some care must be taken to define the more complete arctangent function for points (x, y) when x ≤ 0.[note 1] In the complex plane these polar coordinates take the form
where[note 2]
Here |z| is the absolute value or modulus of the complex number z; θ, the argument of z, is usually taken on the interval 0 ≤ θ < 2π; and the last equality (to |z|eiθ) is taken from Euler's formula. Without the constraint on the range of θ, the argument of z is multi-valued, because the complex exponential function is periodic, with period 2πi. Thus, if θ is one value of arg(z), the other values are given by arg(z) = θ + 2nπ, where n is any non-zero integer.[2]
While seldom used explicitly, the geometric view of the complex numbers is implicitly based on its structure of a Euclidean vector space of dimension 2, where the inner product of complex numbers w and z is given by ; then for a complex number z its absolute value |z| coincides with its Euclidean norm, and its argument arg(z) with the angle turning from 1 to z.
The theory of contour integration comprises a major part of complex analysis. In this context, the direction of travel around a closed curve is important – reversing the direction in which the curve is traversed multiplies the value of the integral by −1. By convention the positive direction is counterclockwise. For example, the unit circle is traversed in the positive direction when we start at the point z = 1, then travel up and to the left through the point z = i, then down and to the left through −1, then down and to the right through −i, and finally up and to the right to z = 1, where we started.
Almost all of complex analysis is concerned with complex functions – that is, with functions that map some subset of the complex plane into some other (possibly overlapping, or even identical) subset of the complex plane. Here it is customary to speak of the domain of f(z) as lying in the z-plane, while referring to the range of f(z) as a set of points in the w-plane. In symbols we write
and often think of the function f as a transformation from the z-plane (with coordinates (x, y)) into the w-plane (with coordinates (u, v)).
Complex plane notation
The complex plane is denoted as .
Argand diagram

Argand diagram refers to a geometric plot of complex numbers as points z = x + iy using the horizontal x-axis as the real axis and the vertical y-axis as the imaginary axis.[3] Such plots are named after Jean-Robert Argand (1768–1822), although they were first described by Norwegian–Danish land surveyor and mathematician Caspar Wessel (1745–1818).[note 3] Argand diagrams are frequently used to plot the positions of the zeros and poles of a function in the complex plane.
Stereographic projections

It can be useful to think of the complex plane as if it occupied the surface of a sphere. Given a sphere of unit radius, place its center at the origin of the complex plane, oriented so that the equator on the sphere coincides with the unit circle in the plane, and the north pole is "above" the plane.
We can establish a one-to-one correspondence between the points on the surface of the sphere minus the north pole and the points in the complex plane as follows. Given a point in the plane, draw a straight line connecting it with the north pole on the sphere. That line will intersect the surface of the sphere in exactly one other point. The point z = 0 will be projected onto the south pole of the sphere. Since the interior of the unit circle lies inside the sphere, that entire region (|z| < 1) will be mapped onto the southern hemisphere. The unit circle itself (|z| = 1) will be mapped onto the equator, and the exterior of the unit circle (|z| > 1) will be mapped onto the northern hemisphere, minus the north pole. Clearly this procedure is reversible – given any point on the surface of the sphere that is not the north pole, we can draw a straight line connecting that point to the north pole and intersecting the flat plane in exactly one point.
Under this stereographic projection the north pole itself is not associated with any point in the complex plane. We perfect the one-to-one correspondence by adding one more point to the complex plane – the so-called point at infinity – and identifying it with the north pole on the sphere. This topological space, the complex plane plus the point at infinity, is known as the extended complex plane. We speak of a single "point at infinity" when discussing complex analysis. There are two points at infinity (positive, and negative) on the real number line, but there is only one point at infinity (the north pole) in the extended complex plane.[5]
Imagine for a moment what will happen to the lines of latitude and longitude when they are projected from the sphere onto the flat plane. The lines of latitude are all parallel to the equator, so they will become perfect circles centered on the origin z = 0. And the lines of longitude will become straight lines passing through the origin (and also through the "point at infinity", since they pass through both the north and south poles on the sphere).
This is not the only possible yet plausible stereographic situation of the projection of a sphere onto a plane consisting of two or more values. For instance, the north pole of the sphere might be placed on top of the origin z = −1 in a plane that is tangent to the circle. The details don't really matter. Any stereographic projection of a sphere onto a plane will produce one "point at infinity", and it will map the lines of latitude and longitude on the sphere into circles and straight lines, respectively, in the plane.
Cutting the plane
When discussing functions of a complex variable it is often convenient to think of a cut in the complex plane. This idea arises naturally in several different contexts.
Multi-valued relationships and branch points
Consider the simple two-valued relationship
Before we can treat this relationship as a single-valued function, the range of the resulting value must be restricted somehow. When dealing with the square roots of non-negative real numbers this is easily done. For instance, we can just define
to be the non-negative real number y such that y2 = x. This idea doesn't work so well in the two-dimensional complex plane. To see why, let's think about the way the value of f(z) varies as the point z moves around the unit circle. We can write and take
Evidently, as z moves all the way around the circle, w only traces out one-half of the circle. So one continuous motion in the complex plane has transformed the positive square root e0 = 1 into the negative square root eiπ = −1.
This problem arises because the point z = 0 has just one square root, while every other complex number z ≠ 0 has exactly two square roots. On the real number line we could circumvent this problem by erecting a "barrier" at the single point x = 0. A bigger barrier is needed in the complex plane, to prevent any closed contour from completely encircling the branch point z = 0. This is commonly done by introducing a branch cut; in this case the "cut" might extend from the point z = 0 along the positive real axis to the point at infinity, so that the argument of the variable z in the cut plane is restricted to the range 0 ≤ arg(z) < 2π.
We can now give a complete description of w = z1/2. To do so we need two copies of the z-plane, each of them cut along the real axis. On one copy we define the square root of 1 to be e0 = 1, and on the other we define the square root of 1 to be eiπ = −1. We call these two copies of the complete cut plane sheets. By making a continuity argument we see that the (now single-valued) function w = z1/2 maps the first sheet into the upper half of the w-plane, where 0 ≤ arg(w) < π, while mapping the second sheet into the lower half of the w-plane (where π ≤ arg(w) < 2π).[6]
The branch cut in this example does not have to lie along the real axis; it does not even have to be a straight line. Any continuous curve connecting the origin z = 0 with the point at infinity would work. In some cases the branch cut doesn't even have to pass through the point at infinity. For example, consider the relationship
Antropológia
Aplikované vedy
Bibliometria
Dejiny vedy
Encyklopédie
Filozofia vedy
Forenzné vedy
Humanitné vedy
Knižničná veda
Kryogenika
Kryptológia
Kulturológia
Literárna veda
Medzidisciplinárne oblasti
Metódy kvantitatívnej analýzy
Metavedy
Metodika
Text je dostupný za podmienok Creative
Commons Attribution/Share-Alike License 3.0 Unported; prípadne za ďalších
podmienok.
Podrobnejšie informácie nájdete na stránke Podmienky
použitia.
www.astronomia.sk | www.biologia.sk | www.botanika.sk | www.dejiny.sk | www.economy.sk | www.elektrotechnika.sk | www.estetika.sk | www.farmakologia.sk | www.filozofia.sk | Fyzika | www.futurologia.sk | www.genetika.sk | www.chemia.sk | www.lingvistika.sk | www.politologia.sk | www.psychologia.sk | www.sexuologia.sk | www.sociologia.sk | www.veda.sk I www.zoologia.sk


