A | B | C | D | E | F | G | H | CH | I | J | K | L | M | N | O | P | Q | R | S | T | U | V | W | X | Y | Z | 0 | 1 | 2 | 3 | 4 | 5 | 6 | 7 | 8 | 9
Athens County | |
|---|---|
 The Athens County court house in Athens | |
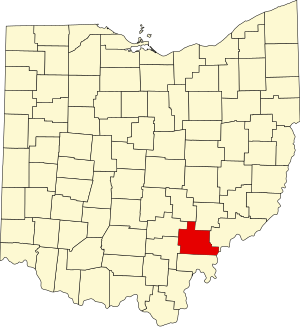
 Location within the U.S. state of Ohio | |
 Ohio's location within the U.S. | |
| Coordinates: 39°20′N 82°03′W / 39.33°N 82.05°W | |
| Country | |
| State | |
| Founded | March 1, 1805[1] |
| Named for | Athens, Greece |
| Seat | Athens |
| Largest city | Athens |
| Area | |
| • Total | 508 sq mi (1,320 km2) |
| • Land | 504 sq mi (1,310 km2) |
| • Water | 4.8 sq mi (12 km2) 1.0% |
| Population (2020) | |
| • Total | 62,431 |
| • Estimate (2022) | 58,979 |
| • Density | 120/sq mi (50/km2) |
| Time zone | UTC−5 (Eastern) |
| • Summer (DST) | UTC−4 (EDT) |
| Congressional district | 12th |
| Website | www |

Athens County is a county in southeastern Ohio. As of the 2020 census, the population was 62,431.[2] Its county seat and largest city is Athens.[3] The county was formed in 1805 from Washington County. Because Ohio's first state university, Ohio University, was established here in 1804, the town and the county are named for the ancient center of learning, Athens, Greece.[4]
Athens County comprises the Athens, OH Micropolitan Statistical Area.
Geography
The county has a total area of 508 square miles (1,320 km2), of which 504 square miles (1,310 km2) is land and 4.8 square miles (12 km2) (1.0%) is water.[5]
Athens County is located in the Unglaciated Allegheny Plateau region of Ohio. It features steep, rugged hills, with typical relief of 150 to 400 feet, deeply dissected by stream valleys, many of them remnant from the ancient Teays River drainage system. Most of Athens County is within the Hocking River watershed, with smaller areas in the Shade River and Raccoon Creek watersheds. The Hocking River joins the Ohio River at the unincorporated village of Hockingport in Athens County.
Adjacent counties
- Perry County (north)
- Morgan County (northeast)
- Washington County (east)
- Wood County, West Virginia (southeast)
- Meigs County (south)
- Vinton County (west)
- Hocking County (northwest)
Demographics
| Census | Pop. | Note | %± |
|---|---|---|---|
| 1810 | 2,791 | — | |
| 1820 | 6,338 | 127.1% | |
| 1830 | 9,787 | 54.4% | |
| 1840 | 19,109 | 95.2% | |
| 1850 | 18,215 | −4.7% | |
| 1860 | 21,364 | 17.3% | |
| 1870 | 23,768 | 11.3% | |
| 1880 | 28,411 | 19.5% | |
| 1890 | 35,194 | 23.9% | |
| 1900 | 38,730 | 10.0% | |
| 1910 | 47,798 | 23.4% | |
| 1920 | 50,430 | 5.5% | |
| 1930 | 44,175 | −12.4% | |
| 1940 | 46,166 | 4.5% | |
| 1950 | 45,839 | −0.7% | |
| 1960 | 46,998 | 2.5% | |
| 1970 | 54,889 | 16.8% | |
| 1980 | 56,399 | 2.8% | |
| 1990 | 59,549 | 5.6% | |
| 2000 | 62,223 | 4.5% | |
| 2010 | 64,757 | 4.1% | |
| 2020 | 62,431 | −3.6% | |
| 2022 (est.) | 58,979 | [6] | −5.5% |
| U.S. Decennial Census[7] 1790-1960[8] 1900-1990[9] 1990-2000[10] 2020 [11] | |||
2000 census
As of the census of 2000, there were 62,223 people, 22,501 households, and 12,713 families living in the county. The population density was 123 inhabitants per square mile (47/km2). There were 24,901 housing units at an average density of 49 units per square mile (19/km2). The racial makeup of the county was 93.48% White, 2.39% Black or African American, 0.28% Native American, 1.90% Asian, 0.02% Pacific Islander, 0.36% from other races, and 1.56% from two or more races. 1.03% of the population were Hispanic or Latino of any race. 21.4% were of German, 13.9% American, 12.9% Irish, 11.1% English, and 5.6% Italian ancestry.
There were 22,501 households, out of which 26.40% had children under the age of 18 living with them, 43.50% were married couples living together, 9.20% had a female householder with no husband present, and 43.50% were non-families. 28.30% of all households were made up of individuals, and 8.30% had someone living alone who was 65 years of age or older. The average household size was 2.40 and the average family size was 2.92.
In the county, the population was spread out, with 18.30% under the age of 18, 30.70% from 18 to 24, 23.70% from 25 to 44, 18.00% from 45 to 64, and 9.30% who were 65 years of age or older. The median age was 26 years. For every 100 females there were 95.60 males. For every 100 females age 18 and over, there were 93.30 males.
The median income for a household in the county was $27,322, and the median income for a family was $39,785. Males had a median income of $30,776 versus $23,905 for females. The per capita income for the county was $14,171. About 14.00% of families and 27.40% of the population were below the poverty line, including 21.20% of those under age 18 and 12.90% of those age 65 or over.
2010 census
As of the census of 2010, there were 64,757 people, 23,578 households, and 12,453 families living in the county.[12] The population density was 128.6 inhabitants per square mile (49.7/km2). There were 26,385 housing units at an average density of 52.4 units per square mile (20.2 units/km2).[13] The racial makeup of the county was 91.8% white, 2.7% black or African American, 2.7% Asian, 0.3% American Indian, 0.4% from other races, and 2.1% from two or more races. Those of Hispanic or Latino origin made up 1.5% of the population.[12] In terms of ancestry, 22.1% were German, 15.2% were American, 14.0% were Irish, 10.4% were English, and 5.5% were Italian.[14]
Of the 23,578 households, 24.3% had children under the age of 18 living with them, 39.3% were married couples living together, 9.2% had a female householder with no husband present, 47.2% were non-families, and 30.0% of all households were made up of individuals. The average household size was 2.35 and the average family size was 2.87. The median age was 26.3 years.[12]
The median income for a household in the county was $31,559 and the median income for a family was $48,170. Males had a median income of $38,135 versus $31,263 for females. The per capita income for the county was $16,642. About 16.6% of families and 30.3% of the population were below the poverty line, including 29.6% of those under age 18 and 9.2% of those age 65 or over.[15]
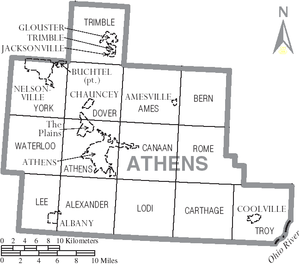
Communities

Cities
- Athens (county seat)
- Nelsonville
Villages
Townships
Census-designated places
Unincorporated communities
Ghost towns
Politics

Biden: 50–60% 60–70% 80–90%
Trump: 40–50% 50–60% 60–70% 70–80%
Like most counties dominated by state universities, Athens County is a Democratic stronghold.[16] It was one of only two counties in Ohio to vote for George McGovern over Richard Nixon in 1972 (along with Lucas County) and in the 2014 gubernatorial election, it was one of only two counties to vote for Democrat Ed FitzGerald over Republican John Kasich (along with Monroe County). From 2016 to 2020, as Ohio has veered rightward, Athens County has become the lone base of Democratic strength in Appalachian Ohio.
| Year | Republican | Democratic | Third party | |||
|---|---|---|---|---|---|---|
| No. | % | No. | % | No. | % | |
| 2020 | 10,862 | 41.58% | 14,772 | 56.55% | 486 | 1.86% |
| 2016 | 11,354 | 38.22% | 16,370 | 55.10% | 1,985 | 6.68% |
| 2012 | 8,543 | 30.81% | 18,307 | 66.02% | 878 | 3.17% |
| 2008 | 9,742 | 31.17% | 20,722 | 66.29% | 795 | 2.54% |
| 2004 | 10,847 | 36.10% | 18,998 | 63.23% | 200 | 0.67% |
| 2000 | 9,703 | 38.13% | 13,158 | 51.71% | 2,586 | 10.16% |
| 1996 | 7,154 | 29.87% | 13,418 | 56.02% | 3,382 | 14.12% |
| 1992 | 7,184 | 27.85% | 13,423 | 52.04% | 5,186 | 20.11% |
| 1988 | 9,314 | 45.92% | 10,795 | 53.23% | 172 | 0.85% |
| 1984 | 11,548 | 52.59% | 10,201 | 46.46% | 209 | 0.95% |
| 1980 | 8,170 | 41.26% | 9,514 | 48.05% | 2,117 | 10.69% |
| 1976 | 8,387 | 44.10% | 9,896 | 52.04% | 733 | 3.85% |
| 1972 | 9,735 | 48.88% | 9,977 | 50.10% | 203 | 1.02% |
| 1968 | 7,837 | 47.79% | 7,351 | 44.82% | 1,212 | 7.39% |
| 1964 | 6,211 | 36.87% | 10,633 | 63.13% | 0 | 0.00% |
| 1960 | 10,747 | 58.76% | 7,542 | 41.24% | 0 | 0.00% |
| 1956 | 10,794 | 64.43% | 5,959 | 35.57% | 0 | 0.00% |
| 1952 | 10,829 | 60.37% | 7,108 | 39.63% | 0 | 0.00% |
| 1948 | 8,902 | 54.43% | 7,398 | 45.24% | 54 | 0.33% |
| 1944 | 10,326 | 58.13% | 7,438 | 41.87% | 0 | 0.00% |
| 1940 | 11,213 | 49.48% | 11,449 | 50.52% | 0 | 0.00% |
| 1936 | 9,509 | 41.48% | 13,205 | 57.61% | 208 | 0.91% |
| 1932 | 9,897 | 51.17% | 8,915 | 46.09% | 531 | 2.75% |
| 1928 | 11,101 | 70.02% | 4,546 | 28.67% | 208 | 1.31% |
| 1924 | 8,695 | 58.19% | 2,669 | 17.86% | 3,579 | 23.95% |
| 1920 | 11,016 | 61.54% | 6,523 | 36.44% | Zdroj:https://en.wikipedia.org?pojem=Athens_County||

