A | B | C | D | E | F | G | H | CH | I | J | K | L | M | N | O | P | Q | R | S | T | U | V | W | X | Y | Z | 0 | 1 | 2 | 3 | 4 | 5 | 6 | 7 | 8 | 9


The distribution of wealth is a comparison of the wealth of various members or groups in a society. It shows one aspect of economic inequality or economic heterogeneity.
The distribution of wealth differs from the income distribution in that it looks at the economic distribution of ownership of the assets in a society, rather than the current income of members of that society. According to the International Association for Research in Income and Wealth, "the world distribution of wealth is much more unequal than that of income."[1]
For rankings regarding wealth, see list of countries by wealth equality or list of countries by wealth per adult.
Definition of wealth
Wealth of an individual is defined as net worth, expressed as: wealth = assets − liabilities
A broader definition of wealth, which is rarely used in the measurement of wealth inequality, also includes human capital. For example, the United Nations definition of inclusive wealth is a monetary measure which includes the sum of natural, human and physical assets.[2][3]
The relation between wealth, income, and expenses is: change of wealth = saving = income − consumption (expenses). If an individual has a large income but also large expenses, the net effect of that income on her or his wealth could be small or even negative.
Conceptual framework
There are many ways in which the distribution of wealth can be analyzed. One common-used example is to compare the amount of the wealth of individual at say 99 percentile relative to the wealth of the median (or 50th) percentile. This is P99/P50 is one of the potential Kuznets ratios which is the inverted U shape that indicates the relationship between the inequality and the income per capita. Another common measure is the ratio of total amount of wealth in the hand of top say 1% of the wealth distribution over the total wealth in the economy. In many societies, the richest ten percent control more than half of the total wealth.
The Pareto Distribution has often been used to mathematically quantify the distribution of wealth at the right tail (the wealth of the very rich); stating that the upper 20% owns 80%, the upper 4% owns 64%, the upper 0.8% owns 51.2%, etc. In fact, the tail of wealth distributions, similar to that of income distribution, behaves like a Pareto distribution but with a thicker tail.
Wealth over people (WOP) curves are a visually compelling way to show the distribution of wealth in a nation. WOP curves are modified distribution of wealth curves. The vertical and horizontal scales each show percentages from zero to one hundred. We imagine all the households in a nation being sorted from richest to poorest. They are then shrunk down and lined up (richest at the left) along the horizontal scale. For any particular household, its point on the curve represents how their wealth compares (as a proportion) to the average wealth of the richest percentile. For any nation, the average wealth of the richest 1/100 of households is the topmost point on the curve (people, 1%; wealth, 100%) or (p=1, w=100) or (1, 100). In the real world two points on the WOP curve are always known before any statistics are gathered. These are the topmost point (1, 100) by definition, and the rightmost point (poorest people, lowest wealth) or (p=100, w=0) or (100, 0). This unfortunate rightmost point is given because there are always at least one percent of households (incarcerated, long term illness, etc.) with no wealth at all. Given that the topmost and rightmost points are fixed ... our interest lies in the form of the WOP curve between them. There are two extreme possible forms of the curve. The first is the "perfect communist" WOP. It is a straight line from the leftmost (maximum wealth) point horizontally across the people scale to p=99. Then it drops vertically to wealth = 0 at (p=100, w=0).
The other extreme is the "perfect tyranny" form. It starts on the left at the Tyrant's maximum wealth of 100%. It then immediately drops to zero at p=2, and continues at zero horizontally across the rest of the people. That is, the tyrant and his friends (the top percentile) own all the nation's wealth. All other citizens are serfs or slaves. An obvious intermediate form is a straight line connecting the left/top point to the right/bottom point. In such a "Diagonal" society a household in the richest percentile would have just twice the wealth of a family in the median (50th) percentile. Such a society is compelling to many (especially the poor). In fact it is a comparison to a diagonal society that is the basis for the Gini values used as a measure of the disequity in a particular economy. These Gini values (40.8 in 2007) show the United States to be the third most dis-equitable economy of all the developed nations (behind Denmark and Switzerland).
More sophisticated models have also been proposed.[4]
Theoretical approaches
To model aspects of the distribution and holdings of wealth, there have been many different types of theories used. Before the 1960s, the data regarding this was collected mostly from wealth tax and estate tax records, with further proof gathered from small unrepresentative examinations and a variety of other sources. The results from these sources tended to show that the distribution of wealth was very unequal, and that material inheritance had a big role in the matter of wealth differences and in the transmission of the status of wealth from generation to generation. There was also reason to believe that the inequality in wealth was shrinking over time, and also the distribution's shape demonstrated particular statistical regularities that could not have been caused by coincidence. Thus, early theoretical work on the distribution of wealth wanted to explain the statistical regularities, and also comprehend the relationship of basic forces which could be an explanation for the concentration of wealth to be high and the trend of declining over time.[5]
More lately, the research about wealth distribution has moved away from the worry with overall distributional characteristics, and in its place focuses more on the grounds of individual differences in the holdings of wealth.[5] This change was caused partly because the importance of saving for retirement increased, and it is reflected in the vital role now assigned to the model of lifecycle savings developed by Modigliani and Brumberg[6] (1954), and Ando and Modigliani[7] (1963). Another important progress has been the increase in availability and finesse in sets of micro-data, which offer not just estimations of individuals' asset holdings and savings but also a variety of other household and personal characteristics that can assist in explain the differences in wealth.[5]
Wealth inequality
Wealth inequality refers to uneven distribution of wealth among individuals and entities. Although most research depends on written sources, archaeologists and anthropologists often view large houses as occupied by wealthy households.[8] The distribution of contemporaneous house sizes in a society (perhaps analyzed using the Gini coefficient) then can regarded as a measure of wealth inequality. This approach has been used at least since 2014[9] and has shown, for example, that ancient wealth disparities in Eurasia were greater than those in North America and in Mesoamerica following the earliest Neolithic period.[10]
Global inequality statistics

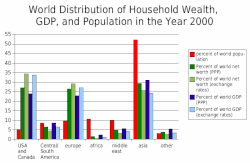
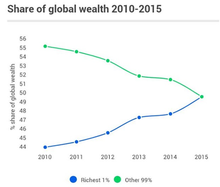
A study by the World Institute for Development Economics Research at United Nations University reports that the richest 1% of adults alone owned 40% of global assets in the year 2000, and that the richest 10% of adults accounted for 85% of the world total. The bottom half of the world adult population owned 1% of global wealth.[13] A 2006 study found that the richest 2% own more than half of global household assets.[14] The Pareto distribution gives 52.8% owned by the upper 1%.
According to the OECD in 2012 the top 0.6% of world population (consisting of adults with more than US$1 million in assets) or the 42 million richest people in the world held 39.3% of world wealth. The next 4.4% (311 million people) held 32.3% of world wealth. The bottom 95% held 28.4% of world wealth. The large gaps of the report get by the Gini index to 0.893, and are larger than gaps in global income inequality, measured in 2009 at 0.38.[15] For example, in 2012 the bottom 60% of the world population held the same wealth in 2012 as the people on Forbes' Richest list consisting of 1,226 richest billionaires of the world.
A 2021 Oxfam report found that collectively, the 10 richest men in the world owned more than the combined wealth of the bottom 3.1 billion people, almost half of the entire world population. Their combined wealth doubled during the pandemic.[16][17][18]
‘Global wealth Report 2021’, published by Credit Suisse, shows a substantial worldwide increase in wealth inequality during 2020. According to Credit Suisse, wealth distribution pyramid in 2020 shows that the richest group of adult population (1.1%) owns 45.8% of the total wealth. When compared to the 2013 wealth distribution pyramid, an overall increase of 4.8% can be seen. The bottom half of the world’s total adult population, the bottom quartile in the pyramid, owns only 1.3% of the total wealth. Again, when compared to the 2013 wealth distribution pyramid, a decrease of 1.7% can be observed. In conclusion, this comparison shows a substantial worldwide increase in wealth inequality over these years.
One of the main explanations for the ongoing increase of wealth inequality are the repercussions of the COVID-19 pandemic. Credit Suisse claims that the economic impact of the pandemic on employment and incomes in 2020 are likely to have a negative effect for the lowest groups of wealth holders, forcing them to spend more from their savings or incur higher debt. On the other hand, top wealth groups appeared to be relatively unaffected in this negative way. Moreover, they seemed to benefit from the impact of lower interest rates on share and house prices.[19][20]
According to the ‘Global Wealth Report 2021’ published by Credit Suisse, there are 56 million millionaires in the world in 2020, increasing by 5.2 million from a year earlier. The biggest number of dollar millionaires is reported in the USA, with 22 million millionaires (approximately 39% of the world total). This is far ahead of China, holding second place, with 9.4% of all global millionaires. The third place is currently being held by Japan, with 6.6% of all global millionaires.[19]
Real estate
While sizeable numbers of households own no land, few have no income. For example, the top 10% of land owners (all corporations) in Baltimore, Maryland own 58% of the taxable land value. The bottom 10% of those who own any land own less than 1% of the total land value.[21] This form of analysis as well as Gini coefficient analysis has been used to support land value taxation.
Wealth distribution pyramid

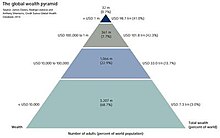
In 2013, Credit Suisse prepared a wealth pyramid infographic (shown right). Personal assets were calculated in net worth, meaning wealth would be negated by having any mortgages.[12] It has a large base of low wealth holders, alongside upper tiers occupied by progressively fewer people. In 2013 Credit-suisse estimate that 3.2 billion individuals – more than two thirds of adults in the world – have wealth below US$10,000. A further one billion (adult population) fall within the 10,000 – US$100,000 range. While the average wealth holding is modest in the base and middle segments of the pyramid, their total wealth amounts to US$40 trillion, underlining the potential for novel consumer products and innovative financial services targeted at this often neglected segment.[20]
The pyramid shows that:
- half of the world's net wealth belongs to the top 1%,
- top 10% of adults hold 85%, while the bottom 90% hold the remaining 15% of the world's total wealth,
- top 30% of adults hold 97% of the total wealth.
Wealth distribution pyramid in 2020
In 2020, Credit Suisse created an updated wealth pyramid infographic. The infographic was constructed similarly to the pyramid in 2013, thus personal assets were calculated in net worth. In 2020, Credit Suisse estimated that approximately 2.88 billion people (55% of adult population) have wealth below US$10,000. Further, 1.7 billion individuals (38.2% of adult population) have wealth within the range of 10,000 – US$100,000. To continue, 583 million people have wealth within the range of 100,000 – US$1,000,000 and approximately 56 million people (1.1% of adult population) have wealth over US$1,000,000.[19]
Comparison of 2013 and 2020 pyramids
Vast differences between 2013 and 2020 infographic can be observed. For the first time, more than 1% of all global adults have wealth over US$1,000,000. Credit Suisse explains in the ‘Global Wealth Report 2021’, that this increase reflects the economic disruption caused by the pandemic and disconnect between the improvement in the financial and real assets of households. However, the biggest difference can be seen in the 10,000 – US$100,000 segment. Since 2013, there had been an increase of almost 10% of total adult population. According to Credit Suisse, the number of adults in this segment tripled since 2000. Credit Suisse explains this fact by stating that this increase was a result of growing prosperity of emerging economies, especially China, and the expansion of the middle class in the developing world. The upper-middle segment, with wealth in a range of 100,000 – US$1,000,000 has increased by 3.4%. Credit Suisse in the report states that the middle class in developed countries typically belong to this group.[19]
Wealth outlook for 2020-2025
According to the ‘Global wealth Report 2021’, published by Credit Suisse, global wealth is projected to rise by 39% over the next five years reaching USD 583 trillion by 2025. Wealth per adult is also projected to increase by 31% and so is the number of global millionaires. The wealth pyramid, an infographic used to determine wealth distribution, will also change. The bottom segment covering adults with a net worth below USD 10,000 will likely decrease by approximately 108 million over the next five years. The lower-middle segment of the pyramid containing adults with a net worth in the range of USD 10,000 and USD 100,000 is projected to rise by 237 million adults. Most of these new members are most likely to be from lower-income countries. The upper-middle segment, consisting of adults with wealth between USD 100,000 and USD 1 million is projected to rise by 178 million adults. Most of these new members (approximately 114 million) are likely to come from upper-middle-income countries. Number of global millionaires is also projected to increase. According to the estimates made by Credit Suisse, the number of global millionaires could exceed 84 million by 2025, a rise of almost 28 million from 2020. The increase of millionaires will not only occur in developed countries such as the USA or other developed countries in Europe, but it is also expected to rapidly increase in lower-income countries. The biggest increase is expected in China, with a change of 92.7%, which is about 4.8 million new dollar millionaires. As a consequence, the number of Ultra High Net Worth Individuals (UHNWI) with net worth exceeding USD 50 million, will also increase.[19]
Gini Coefficient
Gini coefficient (or Gini index) is an indicator that is often used to determine wealth inequality. A Gini coefficient of 0 reflects perfect equality, where all income or wealth values are the same, while a Gini coefficient of 1 (or 100%) reflects maximal inequality among values, a situation where a single individual has all the income while all others have none.[22]According to the Credit Suisse ‘Global wealth Report 2021’, Brunei had the highest Gini coefficient in 2021 (91.6%), therefore the wealth distribution in Brunei is vastly unequal. Slovakia had the lowest Gini coefficient in 2021 (50.3%) out of all countries, which makes Slovakia the most equal country in terms of wealth distribution. When compared to the report made by Credit Suisse in 2019, an increasing trend of wealth inequality can be observed. This may be the result of repercussions of the Covid-19 pandemic. The biggest increase was recorded in Brazil. The Gini coefficient in 2019 was 88.2% and 89% in 2021, with an increase of 0.8% over this period.[23]
The following table was created from information provided by the Credit Suisse Research Institute's "Global Wealth Databook", Table 3-1, published 2021.[23]
Click at right to show/hide table with detailed statistics
| ||||||||||||||||||||||||||||||||||||||||||||||||||||||||||||||||||||||||||||||||||||||||||||||||||||||||||||||||||||||||||||||||||||||||||||||||||||||||||||||||||||||||||||||||||||||||||||||||||||||||||||||||||||||||||||||||||||||||||||||||||||||||||||||||||||||||||||||||||||||||||||||||||||||||||||||||||||||||||||||||||||||||||||||||||||||||||||||||||||||||||||||||||||||||||||||||||||||||||||||||||||||||||||||||||||||
|---|---|---|---|---|---|---|---|---|---|---|---|---|---|---|---|---|---|---|---|---|---|---|---|---|---|---|---|---|---|---|---|---|---|---|---|---|---|---|---|---|---|---|---|---|---|---|---|---|---|---|---|---|---|---|---|---|---|---|---|---|---|---|---|---|---|---|---|---|---|---|---|---|---|---|---|---|---|---|---|---|---|---|---|---|---|---|---|---|---|---|---|---|---|---|---|---|---|---|---|---|---|---|---|---|---|---|---|---|---|---|---|---|---|---|---|---|---|---|---|---|---|---|---|---|---|---|---|---|---|---|---|---|---|---|---|---|---|---|---|---|---|---|---|---|---|---|---|---|---|---|---|---|---|---|---|---|---|---|---|---|---|---|---|---|---|---|---|---|---|---|---|---|---|---|---|---|---|---|---|---|---|---|---|---|---|---|---|---|---|---|---|---|---|---|---|---|---|---|---|---|---|---|---|---|---|---|---|---|---|---|---|---|---|---|---|---|---|---|---|---|---|---|---|---|---|---|---|---|---|---|---|---|---|---|---|---|---|---|---|---|---|---|---|---|---|---|---|---|---|---|---|---|---|---|---|---|---|---|---|---|---|---|---|---|---|---|---|---|---|---|---|---|---|---|---|---|---|---|---|---|---|---|---|---|---|---|---|---|---|---|---|---|---|---|---|---|---|---|---|---|---|---|---|---|---|---|---|---|---|---|---|---|---|---|---|---|---|---|---|---|---|---|---|---|---|---|---|---|---|---|---|---|---|---|---|---|---|---|---|---|---|---|---|---|---|---|---|---|---|---|---|---|---|---|---|---|---|---|---|---|---|---|---|---|---|---|---|---|---|---|---|---|---|---|---|---|---|---|---|---|---|---|---|---|---|---|---|---|---|---|---|---|---|---|---|---|---|---|---|---|---|---|---|---|---|---|---|---|---|---|---|---|---|---|---|---|---|---|---|---|---|---|
| ||||||||||||||||||||||||||||||||||||||||||||||||||||||||||||||||||||||||||||||||||||||||||||||||||||||||||||||||||||||||||||||||||||||||||||||||||||||||||||||||||||||||||||||||||||||||||||||||||||||||||||||||||||||||||||||||||||||||||||||||||||||||||||||||||||||||||||||||||||||||||||||||||||||||||||||||||||||||||||||||||||||||||||||||||||||||||||||||||||||||||||||||||||||||||||||||||||||||||||||||||||||||||||||||||||||
