

A | B | C | D | E | F | G | H | CH | I | J | K | L | M | N | O | P | Q | R | S | T | U | V | W | X | Y | Z | 0 | 1 | 2 | 3 | 4 | 5 | 6 | 7 | 8 | 9
Worcestershire County Council elections
...Worcestershire County Council elections are held every four years. Worcestershire County Council is the upper-tier local authority for the non-metropolitan county of Worcestershire in England. Since the last boundary changes in 2005, 57 councillors have been elected from 52 electoral divisions.[1]
Council elections
- 1997 Worcestershire County Council election
- 2001 Worcestershire County Council election
- 2005 Worcestershire County Council election (new division boundaries)[1]
- 2009 Worcestershire County Council election
- 2013 Worcestershire County Council election
- 2017 Worcestershire County Council election
- 2021 Worcestershire County Council election
County result maps
-
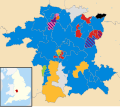 2013 results map
 -
 2017 results map
 -
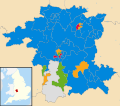 2021 results map


By-election results
2005-2009
| Party | Candidate | Votes | % | ±% | |
|---|---|---|---|---|---|
| Liberal | Graham Ballinger | 1,059 | 50.0 | +8.7 | |
| Conservative | Tracey Onslow | 672 | 31.8 | +9.6 | |
| Health Concern | Howard Martin | 252 | 11.9 | +2.4 | |
| Labour | Dan Watson | 133 | 6.3 | -13.9 | |
| Majority | 387 | 18.3 | |||
| Turnout | 2,116 | ||||
| Liberal hold | Swing | ||||
| Party | Candidate | Votes | % | ±% | |
|---|---|---|---|---|---|
| Conservative | Juliet Brunner | 1,437 | 42.2 | +9.9 | |
| Labour | Debbie Taylor | 1,041 | 30.6 | -15.8 | |
| Liberal Democrats | Diane Thomas | 455 | 13.4 | -7.9 | |
| BNP | Maurice Field | 367 | 10.8 | +10.8 | |
| Independent | Richard Armstrong | 103 | 3.0 | +3.0 | |
| Majority | 396 | 11.6 | |||
| Turnout | 3,403 | ||||
| Conservative gain from Labour | Swing | ||||
2009-2013
| Party | Candidate | Votes | % | ±% | |
|---|---|---|---|---|---|
| Conservative | Tony Miller | 1,088 | 59.2 | -1.2 | |
| Liberal Democrats | Margaret Rowley | 536 | 29.2 | +7.2 | |
| Labour | Chris Barton | 213 | 11.6 | +4.6 | |
| Majority | 552 | 30.0 | |||
| Turnout | 1,837 | ||||
| Conservative hold | Swing | ||||
| Party | Candidate | Votes | % | ±% | |
|---|---|---|---|---|---|
| Conservative | June Griffiths | 637 | 52.6 | +11.6 | |
| Labour | Christopher Bloore | 189 | 15.6 | +6.3 | |
| Independent | Dee Morton | 157 | 13.0 | +13.0 | |
| Liberal Democrats | Howard Allen | 83 | 6.9 | -6.3 | |
| Independent | Kenneth Wheatley | 79 | 6.5 | +6.5 | |
| UKIP | Steven Morson | 65 | 5.4 | -16.6 | |
| Majority | 448 | 37.0 | |||
| Turnout | 1,210 | ||||
| Conservative hold | Swing | ||||
2013-2017
| Party | Candidate | Votes | % | ±% | |
|---|---|---|---|---|---|
| Health Concern | John Thomas | 1,055 | 30.6 | +4.1 | |
| UKIP | John Holden | 892 | 25.8 | -1.7 | |
| Conservative | Chris Rogers | 753 | 21.8 | +2.3 | |
| Labour | Carol Warren | 607 | 17.6 | -5.0 | |
| Green | Angela Hartwich | 77 | 2.2 | -1.7 | |
| BNP | Carl Mason | 39 | 1.1 | +1.1 | |
| Liberal Democrats | Paul Preston | 30 | 0.9 | +0.9 | |
| Majority | 163 | 4.7 | |||
| Turnout | 3,453 | ||||
| Health Concern gain from UKIP | Swing | ||||