A | B | C | D | E | F | G | H | CH | I | J | K | L | M | N | O | P | Q | R | S | T | U | V | W | X | Y | Z | 0 | 1 | 2 | 3 | 4 | 5 | 6 | 7 | 8 | 9
A mean is a numeric quantity representing the center of a collection of numbers and is intermediate to the extreme values of a set of numbers.[1] There are several kinds of means (or "measures of central tendency") in mathematics, especially in statistics. Each attempts to summarize or typify a given group of data, illustrating the magnitude and sign of the data set. Which of these measures is most illuminating depends on what is being measured, and on context and purpose.
The arithmetic mean, also known as "arithmetic average", is the sum of the values divided by the number of values. The arithmetic mean of a set of numbers x1, x2, ..., xn is typically denoted using an overhead bar, .[note 1] If the numbers are from observing a sample of a larger group, the arithmetic mean is termed the sample mean () to distinguish it from the group mean (or expected value) of the underlying distribution, denoted or .[note 2][2]
Outside probability and statistics, a wide range of other notions of mean are often used in geometry and mathematical analysis; examples are given below.
Types of means
Pythagorean means
Arithmetic mean (AM)
The arithmetic mean (or simply mean or average) of a list of numbers, is the sum of all of the numbers divided by the number of numbers. Similarly, the mean of a sample , usually denoted by , is the sum of the sampled values divided by the number of items in the sample.
For example, the arithmetic mean of five values: 4, 36, 45, 50, 75 is:
Geometric mean (GM)
The geometric mean is an average that is useful for sets of positive numbers, that are interpreted according to their product (as is the case with rates of growth) and not their sum (as is the case with the arithmetic mean):
For example, the geometric mean of five values: 4, 36, 45, 50, 75 is:
Harmonic mean (HM)
The harmonic mean is an average which is useful for sets of numbers which are defined in relation to some unit, as in the case of speed (i.e., distance per unit of time):
For example, the harmonic mean of the five values: 4, 36, 45, 50, 75 is
If we have five pumps that can empty a tank of a certain size in respectively 4, 36, 45, 50, and 75 minutes, then the harmonic mean of tells us that these five different pumps working together will pump at the same rate as much as five pumps that can each empty the tank in minutes.
Relationship between AM, GM, and HM

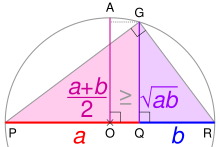
PR is the diameter of a circle centered on O; its radius AO is the arithmetic mean of a and b. Using the geometric mean theorem, triangle PGR's altitude GQ is the geometric mean. For any ratio a:b, AO ≥ GQ.
AM, GM, and HM satisfy these inequalities:
Equality holds if all the elements of the given sample are equal.
Statistical location


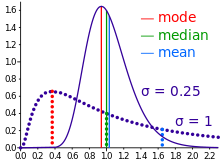
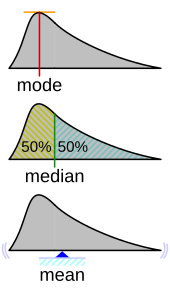
In descriptive statistics, the mean may be confused with the median, mode or mid-range, as any of these may incorrectly be called an "average" (more formally, a measure of central tendency). The mean of a set of observations is the arithmetic average of the values; however, for skewed distributions, the mean is not necessarily the same as the middle value (median), or the most likely value (mode). For example, mean income is typically skewed upwards by a small number of people with very large incomes, so that the majority have an income lower than the mean. By contrast, the median income is the level at which half the population is below and half is above. The mode income is the most likely income and favors the larger number of people with lower incomes. While the median and mode are often more intuitive measures for such skewed data, many skewed distributions are in fact best described by their mean, including the exponential and Poisson distributions.
Mean of a probability distribution
The mean of a probability distribution is the long-run arithmetic average value of a random variable having that distribution. If the random variable is denoted by , then the mean is also known as the expected value of (denoted ). For a discrete probability distribution, the mean is given by , where the sum is taken over all possible values of the random variable and is the probability mass function. For a continuous distribution, the mean is , where
Antropológia
Aplikované vedy
Bibliometria
Dejiny vedy
Encyklopédie
Filozofia vedy
Forenzné vedy
Humanitné vedy
Knižničná veda
Kryogenika
Kryptológia
Kulturológia
Literárna veda
Medzidisciplinárne oblasti
Metódy kvantitatívnej analýzy
Metavedy
Metodika
Text je dostupný za podmienok Creative
Commons Attribution/Share-Alike License 3.0 Unported; prípadne za ďalších
podmienok.
Podrobnejšie informácie nájdete na stránke Podmienky
použitia.
www.astronomia.sk | www.biologia.sk | www.botanika.sk | www.dejiny.sk | www.economy.sk | www.elektrotechnika.sk | www.estetika.sk | www.farmakologia.sk | www.filozofia.sk | Fyzika | www.futurologia.sk | www.genetika.sk | www.chemia.sk | www.lingvistika.sk | www.politologia.sk | www.psychologia.sk | www.sexuologia.sk | www.sociologia.sk | www.veda.sk I www.zoologia.sk


