

A | B | C | D | E | F | G | H | CH | I | J | K | L | M | N | O | P | Q | R | S | T | U | V | W | X | Y | Z | 0 | 1 | 2 | 3 | 4 | 5 | 6 | 7 | 8 | 9
Edwards County | |
|---|---|
 Edwards County Courthouse in Albion | |
 Location within the U.S. state of Illinois | |
 Illinois's location within the U.S. | |
| Coordinates: 38°25′N 88°04′W / 38.42°N 88.06°W | |
| Country | |
| State | |
| Founded | 1814 |
| Named for | Ninian Edwards |
| Seat | Albion |
| Largest city | Albion |
| Area | |
| • Total | 223 sq mi (580 km2) |
| • Land | 222 sq mi (570 km2) |
| • Water | 0.3 sq mi (0.8 km2) 0.1% |
| Population (2020) | |
| • Total | 6,245 |
| • Density | 28/sq mi (11/km2) |
| Time zone | UTC−6 (Central) |
| • Summer (DST) | UTC−5 (CDT) |
| Congressional district | 12th |
Edwards County is a county located in the U.S. state of Illinois. As of the 2020 census, the population was 6,245.[1] Its county seat is Albion.[2]
History
Edwards County was named for Ninian Edwards,[3] the governor of the Illinois Territory, and, later, governor of Illinois.
Edwards County is subdivided into "Road Districts", rather than "Townships" as in most Illinois counties. Pursuant to the Land Ordinance of 1785, the Northwest Territory (including Illinois) was surveyed and mostly organized into townships that are six miles square; but Edwards County was settled prior to that survey, and its pre-existing Road Districts do not generally correspond with the survey's townships.
-
-

-
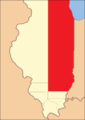
 The county between 1819 and 1821. At this point Crawford County was split off from Edwards, and Wayne Counties.
 -
 Edwards between 1821 and 1824
 -
 Edwards in 1824, reduced to its current size by the creation of Wabash County


Geography
According to the U.S. Census Bureau, the county has a total area of 223 square miles (580 km2), of which 222 square miles (570 km2) is land and 0.3 square miles (0.78 km2) (0.1%) is water.[4] It is the fourth-smallest county in Illinois by area.
When Edwards County was formed in 1814, it comprised nearly half of the State of Illinois. New counties were formed from it until, in 1824, it assumed its present form from the creation of Wabash County. The two are the fourth and fifth smallest counties in Illinois.
Edwards County is separated from Wabash County by the Bonpas Creek.
Climate and weather
| Albion, Illinois | ||||||||||||||||||||||||||||||||||||||||||||||||||||||||||||
|---|---|---|---|---|---|---|---|---|---|---|---|---|---|---|---|---|---|---|---|---|---|---|---|---|---|---|---|---|---|---|---|---|---|---|---|---|---|---|---|---|---|---|---|---|---|---|---|---|---|---|---|---|---|---|---|---|---|---|---|---|
| Climate chart (explanation) | ||||||||||||||||||||||||||||||||||||||||||||||||||||||||||||
| ||||||||||||||||||||||||||||||||||||||||||||||||||||||||||||
| ||||||||||||||||||||||||||||||||||||||||||||||||||||||||||||
In recent years, average temperatures in the county seat of Albion have ranged from a low of 21 °F (−6 °C) in January to a high of 89 °F (32 °C) in July, although a record low of −20 °F (−29 °C) was recorded in January 1982 and a record high of 109 °F (43 °C) was recorded in July 1954. Average monthly precipitation ranged from 2.57 inches (65 mm) in January to 5.13 inches (130 mm) in April.[5]
Major highways
Adjacent counties
- Richland County (north)
- Wabash County (east)
- White County (south)
- Wayne County (west)
Demographics
| Census | Pop. | Note | %± |
|---|---|---|---|
| 1820 | 3,444 | — | |
| 1830 | 1,649 | −52.1% | |
| 1840 | 3,070 | 86.2% | |
| 1850 | 3,524 | 14.8% | |
| 1860 | 5,454 | 54.8% | |
| 1870 | 7,565 | 38.7% | |
| 1880 | 8,597 | 13.6% | |
| 1890 | 9,444 | 9.9% | |
| 1900 | 10,345 | 9.5% | |
| 1910 | 10,049 | −2.9% | |
| 1920 | 9,431 | −6.1% | |
| 1930 | 8,303 | −12.0% | |
| 1940 | 8,974 | 8.1% | |
| 1950 | 9,056 | 0.9% | |
| 1960 | 7,940 | −12.3% | |
| 1970 | 7,090 | −10.7% | |
| 1980 | 7,961 | 12.3% | |
| 1990 | 7,440 | −6.5% | |
| 2000 | 6,971 | −6.3% | |
| 2010 | 6,721 | −3.6% | |
| 2020 | 6,245 | −7.1% | |
| 2023 (est.) | 5,968 | [6] | −4.4% |
| U.S. Decennial Census[7] 1790-1960[8] 1900-1990[9] 1990-2000[10] 2010-2017[11] | |||

As of the 2010 United States Census, there were 6,721 people, 2,840 households, and 1,926 families residing in the county.[12] The population density was 30.2 inhabitants per square mile (11.7/km2). There were 3,187 housing units at an average density of 14.3 per square mile (5.5/km2).[4] The racial makeup of the county was 98.0% white, 0.4% black or African American, 0.3% Asian, 0.1% American Indian, 0.3% from other races, and 0.8% from two or more races. Those of Hispanic or Latino origin made up 0.9% of the population.[12] In terms of ancestry, 26.8% were German, 22.4% were English, 13.3% were American, and 8.4% were Irish.[13]
Of the 2,840 households, 28.9% had children under the age of 18 living with them, 54.8% were married couples living together, 8.3% had a female householder with no husband present, 32.2% were non-families, and 28.5% of all households were made up of individuals. The average household size was 2.35 and the average family size was 2.86. The median age was 42.7 years.[12]
The median income for a household in the county was $40,430 and the median income for a family was $51,337. Males had a median income of $40,183 versus $27,295 for females. The per capita income for the county was $21,113. About 10.6% of families and 12.2% of the population were below the poverty line, including 17.1% of those under age 18 and 12.3% of those age 65 or over.[14]
Communities

Cities
Villages
Unincorporated Communities
Precincts
Edwards County is divided into 12 election precincts:
Politics
Edwards County is one of the most consistently Republican counties in the nation. It has voted for the Republican candidate in all Presidential elections from 1856 to present, except in 1912 when the party was divided and Theodore Roosevelt won the county as the “Bull Moose” Progressive candidate.[15] In the last five Presidential elections no Democratic candidate has reached 34 percent of the county's vote.[16] Edwards County also holds the distinction of having the lowest percentage of any Illinois county of votes for governor Pat Quinn, a Democrat, in his failed 2014 reelection bid. Quinn lost 101 of the 102 counties in Illinois, capturing only 13.7% of the vote in Edwards County.[17] Hillary Clinton fared even worse in 2016 with only 13.1 percent of the county's ballots. The last Democrat to win the county was Andrew Jackson in 1832.
| Year | Republican | Democratic | Third party | |||
|---|---|---|---|---|---|---|
| No. | % | No. | % | No. | % | |
| 2020 | 2,833 | 84.12% | 488 | 14.49% | 47 | 1.40% |
| 2016 | 2,778 | 83.57% | 434 | 13.06% | 112 | 3.37% |
| 2012 | 2,405 | 74.50% | 754 | 23.36% | 69 | 2.14% |
| 2008 | 2,137 | 63.56% | 1,140 | 33.91% | 85 | 2.53% |
| 2004 | 2,412 | 71.70% | 930 | 27.65% | 22 | 0.65% |
| 2000 | 2,212 | 67.85% | 978 | 30.00% | 70 | 2.15% |
| 1996 | 1,613 | 51.98% | 1,089 | 35.10% | 401 | 12.92% |
| 1992 | 1,601 | 45.07% | 1,299 | 36.57% | 652 | 18.36% |
| 1988 | 2,212 | 64.12% | 1,218 | 35.30% | 20 | 0.58% |
| 1984 | 2,778 | 72.25% | 1,057 | 27.49% | 10 | 0.26% |
| 1980 | 2,556 | 68.14% | 1,041 | 27.75% | 154 | 4.11% |
| 1976 | 2,379 | 58.51% | 1,648 | 40.53% | 39 | 0.96% |
| 1972 | 3,017 | 73.93% | 1,055 | 25.85% | 9 | 0.22% |
| 1968 | 2,633 | 63.68% | 1,095 | 26.48% | 407 | 9.84% |
| 1964 | 2,262 | 53.19% | 1,991 | 46.81% | 0 | 0.00% |
| 1960 | 3,291 | 69.36% | 1,446 | 30.47% | 8 | 0.17% |
| 1956 | 3,339 | 73.38% | 1,210 | 26.59% | 1 | 0.02% |
| 1952 | 3,502 | 75.01% | 1,162 | 24.89% | 5 | 0.11% |
| 1948 | 2,491 | 66.07% | 1,206 | 31.99% | 73 | 1.94% |
| 1944 | 3,016 | 70.96% | 1,197 | 28.16% | 37 | 0.87% |