A | B | C | D | E | F | G | H | CH | I | J | K | L | M | N | O | P | Q | R | S | T | U | V | W | X | Y | Z | 0 | 1 | 2 | 3 | 4 | 5 | 6 | 7 | 8 | 9
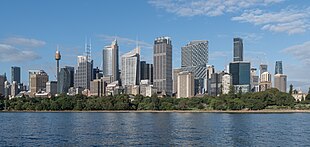
 Sydney's central business district is Australia's largest financial and business services hub. | |
| Currency | Australian dollar (AUD) |
|---|---|
| 1 July – 30 June | |
Trade organisations | APEC, CPTPP, G20, OECD, WTO, RCEP |
Country group | |
| Statistics | |
| Population | |
| GDP | |
| GDP rank | |
GDP growth | |
GDP per capita | |
GDP per capita rank | |
GDP by sector | |
| |
Population below poverty line | 13.4% (2020)[7] |
| |
Labour force | |
Labour force by occupation |
|
| Unemployment | |
Average gross salary | A$7,890 / $5,031.37 monthly[12] (2022) |
| A$6,076 / $3,874.21 monthly[13][14] (2022) | |
Main industries |
|
| External | |
| Exports | A$670.6 billion (2022)[17] |
Export goods | iron ore, coal, natural gas, gold, aluminium, beef, crude petroleum, copper, meat (non-beef)[17] |
Main export partners |
|
| Imports | A$530.3 billion (2022)[17] |
Import goods | petroleum, cars, telecom equipment and parts, goods vehicles, computers, medicaments, gold, civil engineering equipment, furniture[17] |
Main import partners |
|
FDI stock |
|
Gross external debt | |
| Public finances | |
| 66.4% of GDP (October 2021)[21] | |
| −0.2% (of GDP) (2019)[22][23] | |
| Revenues | A$668.1 billion (2023)[22] |
| Expenses | A$682.1 billion (2023)[22] |
| Economic aid | donor: ODA, $4.09 billion (2022)[24] |
| $66.58 billion (31 December 2017 est.)[28] | |
Australia is a highly developed country with a mixed economy.[29][30] As of 2023, Australia was the 14th-largest national economy by nominal GDP (gross domestic product),[31] the 19th-largest by PPP-adjusted GDP,[32] and was the 21st-largest goods exporter and 24th-largest goods importer.[33] Australia took the record for the longest run of uninterrupted GDP growth in the developed world with the March 2017 financial quarter. It was the 103rd quarter and the 26th year since the country had a technical recession (two consecutive quarters of negative growth).[34] As of June 2021, the country's GDP was estimated at $1.98 trillion.[35]
The Australian economy is dominated by its service sector, which in 2017 comprised 62.7% of the GDP and employed 78.8% of the labour force.[5] At the height of the mining boom in 2009–10, the total value-added of the mining industry was 8.4% of GDP.[36] Despite the recent decline in the mining sector, the Australian economy has remained resilient and stable[37][38] and did not experience a recession from 1991 until 2020.[39][40] Among OECD members, Australia has a highly efficient and strong social security system, which comprises roughly 25% of GDP.[41][42][43]
The Australian Securities Exchange in Sydney is the 16th-largest stock exchange in the world in terms of domestic market capitalisation[44] and has one of the largest interest rate derivatives markets in the Asia-Pacific region.[45] Some of Australia's largest companies include Commonwealth Bank, BHP, CSL, Westpac, NAB, ANZ, Fortescue Metals Group, Wesfarmers, Macquarie Group, Woolworths Group, Rio Tinto, Telstra, Woodside Energy, and Transurban.[46] The currency of Australia and its territories is the Australian dollar, which it shares with several Pacific nation states.
Australia's economy is strongly intertwined with the countries of East and Southeast Asia, also known as ASEAN Plus Three (APT), accounting for about 64% of exports in 2016.[47] China in particular is Australia's main export and import partner by a wide margin.[48] Australia is a member of the APEC, G20, OECD and WTO. The country has also entered into free trade agreements with ASEAN, Canada, Chile, China, South Korea, Malaysia, New Zealand, Peru, Japan, Singapore, Thailand and the United States.[49][50][51] The ANZCERTA agreement with New Zealand has greatly increased integration with the economy of New Zealand.[52]
History
20th century
Australia's average GDP growth rate for the period 1901–2000 was 3.4% annually. As opposed to many neighbouring Southeast Asian countries, the process towards independence was relatively peaceful and thus did not have significant negative impact on the economy and standard of living.[53] Growth peaked during the 1920s, followed by the 1950s and the 1980s. By contrast, the late 1910s/early 1920s, the 1930s, the 1970s and early 1990s were marked by financial crises.
Economic liberalisation


From the early 1980s onwards, the Australian economy has undergone intermittent economic liberalisation. In 1983, under prime minister Bob Hawke, but mainly driven by treasurer Paul Keating, the Australian dollar was floated and financial deregulation was undertaken.
Early 1990s recession
The early 1990s recession came swiftly after the Black Monday of October 1987, as a result of a stock collapse of unprecedented size which caused the Dow Jones Industrial Average to fall by 22.6%. This collapse, larger than the stock market crash of 1929, was handled effectively by the global economy and the stock market began to quickly recover. But in North America, the lumbering savings and loans industry was facing decline, which eventually led to a savings and loan crisis which compromised the well-being of millions of US people. The following recession thus impacted the many countries closely linked to the US, including Australia. Paul Keating, who was treasurer at the time, famously referred to it as "the recession that Australia had to have."[54] During the recession, GDP fell by 1.7%, employment by 3.4% and the unemployment rate rose to 10.8%.[55] However, the recession did assist in reducing long-term inflation rate expectations and Australia has maintained a low inflation environment since the 1990s to the present day.
Mining
Mining has contributed to Australia's high level of economic growth, from the gold rush in the 1840s to the present day. The opportunities for large profits in pastoralism and mining attracted considerable amounts of British capital, while expansion was supported by enormous government outlays for transport, communication, and urban infrastructures, which also depended heavily on British finance. As the economy expanded, large-scale immigration satisfied the growing demand for workers, especially after the end of convict transportation to the eastern mainland in 1840. Australia's mining operations secured continued economic growth and Western Australia itself benefited strongly from mining iron ore and gold from the 1960s and 1970s which fuelled the rise of suburbanisation and consumerism in Perth, the capital and most populous city of Western Australia, as well as other regional centres.
Global financial crisis
The Australian government stimulus package ($11.8 billion) helped to prevent a recession.[56]
The World Bank expected Australia's GDP growth rate to be 3.2% in 2011 and 3.8% in 2012.[57] The economy expanded by 0.4% in the fourth quarter of 2011, and expanded by 1.3% in the first quarter of 2012.[58][59] The growth rate was reported to be 4.3% year-on-year.[60]
The International Monetary Fund in April 2012 predicted that Australia would be the best-performing major advanced economy in the world over the next two years; the Australian Government Department of the Treasury anticipated "forecast growth of 3.0% in 2012 and 3.5% in 2013",[61] the National Australia Bank in April 2012 cut its growth forecast for Australia to 2.9% from 3.2%.,[62] and JP Morgan in May 2012 cut its growth forecast to 2.7% in calendar 2012 from a previous forecast of 3.0%, also its forecast for growth in 2013 to 3.0% from 3.3%.[63] Deutsche Bank in August 2012, and Société Générale in October 2012, warned that there is risk of recession in Australia in 2013.[64][65]
While Australia's overall national economy grew, some non-mining states and Australia's non-mining economy experienced a recession.[66][67][68]
2020 recession
In September 2020, it was confirmed that due to the effects of the COVID-19 pandemic, the Australian economy had gone into recession for the first time in nearly thirty years, as the country's GDP fell 7 per cent in the June 2020 quarter, following a 0.3 per cent drop in the March quarter.[69][70][71] It officially ended at the beginning of December 2020.[72]
Data
The following table shows the main economic indicators in 1980–2021 (with IMF staff estimates in 2022–2027). Inflation under 5% is in green.[73]
| Year | GDP
(in bil. US$PPP) |
GDP per capita
(in US$PPP) |
GDP
(in bil. US$nominal) |
GDP per capita
(in US$ nominal) |
GDP growth
(real) |
Inflation rate
(in percent) |
Unemployment
(in percent) |
Government debt
(in % of GDP) |
|---|---|---|---|---|---|---|---|---|
| 1980 | 155.4 | 10,498.0 | 162.8 | 11,000.1 | 6.1% | n/a | ||
| 1981 | n/a | |||||||
| 1982 | n/a | |||||||
| 1983 | n/a | |||||||
| 1984 | n/a | |||||||
| 1985 | n/a | |||||||
| 1986 | n/a | |||||||
| 1987 | n/a | |||||||
| 1988 | n/a | |||||||
| 1989 | 17.0% | |||||||
| 1990 | ||||||||
| 1991 | ||||||||
| 1992 | ||||||||
| 1993 | Text je dostupný za podmienok Creative Commons Attribution/Share-Alike License 3.0 Unported; prípadne za ďalších podmienok. Podrobnejšie informácie nájdete na stránke Podmienky použitia.
Analytika
Antropológia Aplikované vedy Bibliometria Dejiny vedy Encyklopédie Filozofia vedy Forenzné vedy Humanitné vedy Knižničná veda Kryogenika Kryptológia Kulturológia Literárna veda Medzidisciplinárne oblasti Metódy kvantitatívnej analýzy Metavedy Metodika Text je dostupný za podmienok Creative
Commons Attribution/Share-Alike License 3.0 Unported; prípadne za ďalších
podmienok. www.astronomia.sk | www.biologia.sk | www.botanika.sk | www.dejiny.sk | www.economy.sk | www.elektrotechnika.sk | www.estetika.sk | www.farmakologia.sk | www.filozofia.sk | Fyzika | www.futurologia.sk | www.genetika.sk | www.chemia.sk | www.lingvistika.sk | www.politologia.sk | www.psychologia.sk | www.sexuologia.sk | www.sociologia.sk | www.veda.sk I www.zoologia.sk |
