

A | B | C | D | E | F | G | H | CH | I | J | K | L | M | N | O | P | Q | R | S | T | U | V | W | X | Y | Z | 0 | 1 | 2 | 3 | 4 | 5 | 6 | 7 | 8 | 9
| Demographics of Japan | |
|---|---|
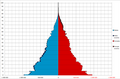
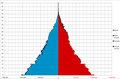
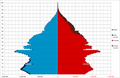
 Population pyramid, 2021 | |
| Population | 123,990,000[1][2] (11th) |
| Growth rate | -0.7% (2020 est.) |
| Birth rate | 6.6 births/1,000 population (2023 est.) |
| Death rate | 11.7 deaths/1,000 population (2023 est.) |
| Life expectancy | 84.83 years |
| • male | 81 years |
| • female | 87 years |
| Fertility rate | |
| Infant mortality rate | 1.9 deaths/1,000 live births |
| Net migration rate | 0.74 migrant(s)/1,000 population |
| Age structure | |
| 0–14 years | |
| 15–64 years | |
| 65 and over | |
| Sex ratio | |
| Total | 0.95 male(s)/female (2022 est.) |
| At birth | 1.06 male(s)/female |
| Nationality | |
| Nationality | Japanese |
| Major ethnic | Japanese |


The demographics of Japan include birth and death rates, age distribution, population density, ethnicity, education level, healthcare system of the populace, economic status, religious affiliations, and other aspects regarding the Japanese population. According to the United Nations, the population of Japan was roughly 126.4 million people (as of January 2020), which peaked from 128.5 million people in 2010. It is the 6th-most populous country in Asia, and the 11th-most populous country in the world.
In 2023, the median age of Japanese people was projected to be 49.5 years, the highest level since 1950, compared to 29.5 for India, 38.8 for the United States and 39.8 for China. Japan has the second highest median age in the world (behind only Monaco). An improved quality of life and regular health checks are just two reasons why Japan has one of the highest life expectancies in the world.
The life expectancy from birth in Japan improved significantly after World War II, rising 20 years in the decade between 1945 and 1955. As life expectancy rises further, Japan expects to experience difficulties caring for the older generations in the future. Shortages in the service sector are already a major concern, with demand for nurses and care workers increasing.
The fertility rate among Japanese women was around 1.4 children per woman from 2010 to 2018. From then until 2022, the fertility rate further declined to 1.2. Apart from a small baby boom in the early 1970s, the crude birth rate in Japan has been declining since 1950; it reached its currently lowest point of 6.6 births per thousand people in 2023. With a falling birth rate and a large share of its inhabitants reaching old age, Japan's total population is expected to continue declining, a trend that has been seen since 2010.
Japanese is a major language of the Japonic language family spoken by Japanese people, which is separated into several dialects with the Tokyo dialect considered Standard Japanese. It has around 128 million speakers in total, primarily in Japan, the only country where it is the national language, and within the Japanese diaspora across the globe.
The sex ratio in Japan in 2021 was 95.38 males per 100 females. There are 61.53 million males and 64.52 million females in Japan. The percentage of female population is 51.18%, compared to 48.82% male population. Japan has 2.98 million more females than males.
Historical overview
| Year | Pop. | ±% |
|---|---|---|
| 1920 | 55,963,053 | — |
| 1925 | 59,736,822 | +6.7% |
| 1930 | 64,450,005 | +7.9% |
| 1935 | 69,254,148 | +7.5% |
| 1940 | 73,114,308 | +5.6% |
| 1945 | 71,998,104 | −1.5% |
| 1950 | 83,199,637 | +15.6% |
| 1955 | 89,275,529 | +7.3% |
| 1960 | 93,418,501 | +4.6% |
| 1965 | 98,274,961 | +5.2% |
| 1970 | 103,720,060 | +5.5% |
| 1975 | 111,939,643 | +7.9% |
| 1980 | 117,060,396 | +4.6% |
| 1985 | 121,048,923 | +3.4% |
| 1990 | 123,611,167 | +2.1% |
| 1995 | 125,570,246 | +1.6% |
| 2000 | 126,925,843 | +1.1% |
| 2005 | 127,767,994 | +0.7% |
| 2010 | 128,057,352 | +0.2% |
| 2015 | 127,094,745 | −0.8% |
| 2020 | 126,226,568 | −0.7% |
| Population size may be affected by changes in administrative divisions. | ||
As of 2017, Japan was the world's eleventh-most populous country. The total population had declined by 0.8 percent from the time of the census five years previously, the first time it had declined since the 1945 census.[5]
Since 2010, Japan has experienced net population loss due to falling birth rates and minimal immigration, despite having one of the highest life expectancies in the world, at 85.00 years as of 2016[update] (it stood at 81.25 as of 2006).[6] Using the annual estimate for October of each year, the population peaked in 2008 at 128,083,960 and had fallen by 2,983,352 by October 2021.[7]
Based on 2012 data from the National Institute of Population and Social Security Research, Japan's population will keep declining by about one million people every year in the coming decades, which would leave it with a population of around 70 million by 2060 and 42 million by early 22nd century if the current projections do not change.[8] More than 40% of the population is expected to be over the age of 65 in 2060.[9] In 2021 the population had for fifteen consecutive years declined by 644,000 on this year, the largest drop on record since 1945 and also reflecting a record low of 831,000 births. As of 2013[update] more than 20 percent of the population of Japan were aged 65 and over.[10]
The population consisted of 47,062,743 households, with 78.7% in urban areas (July 2000). High population density; 329.5 people per square kilometer for total area; 1,523 persons per square kilometer for habitable land. More than 50% of the population lives on 2% of the land. (July 1993).[11] According to research in 2009, the population to land density ratio has gradually increased, now at 127 million per 337 km2. Compared to the findings of July 1993 as well as in July 2000, the population density has greatly increased, from 50% of the population living on 2% of the land to 77%. However, as the years have progressed since the last recordings of the population, Japan's population has decreased, raising concern about the future of Japan. There are many causes, such as the declining birthrates, as well as the ratio of men to women since the last measurements from the years of 2006 and 2010. According to the Japanese Health Ministry, the population is estimated to drop from its current state of 125.58 million to 86.74 million by the year 2060.[12]
Japan dropped from the 5th most populous country in the world to 6th in 1964, 7th in 1978, 8th in 1990, to 9th in 1998, to 10th in the early 21st century, 11th in 2020, and to 12th in 2023.[13][14] Over the period of 2010 to 2015, the population shrank by almost a million,[15] and Japan lost a half-million in 2022 alone.[16] The number of Japanese citizens decreased by 801,000 to 122,423,038 in 2022 from a year earlier, which was the most severe decrease and the first time all 47 prefectures have suffered a decline since the launch of the poll in 1968. The nation's population reached 128,057,352 Japanese people by early 2010. However, the long-lasting effects of Japanese economic crisis during the Great Recession strongly slowed down immigration rates in Japan in 2010s.
In March 2011, Japan suffered from the triple disaster (earthquake, tsunami, and nuclear disaster, etc.), resulting 20,000 deaths, a reduction of about 1.39 years in the average life expectancy, an ultimate decrease in birth rates, and a marked decrease in immigration rates, worst since the end of World War II.
According to studies from the Institute for Health Metrics and Evaluation, from January 2020 to the end of September 2021 as a direct effect of COVID-19 pandemic, Japan registered at least 112,000 excess deaths with six times higher,[17] a reduction of about 2.6 years in the average life expectancy, a noticeable decrease in birth rates and a marked decrease in immigration rates, the overall effect being a record natural population decline of 798,214 units[clarification needed] in that year, although the excess mortality rate for all causes has been estimated at between 100,000 and 130,000 deaths. It is the largest ever recorded since 1914 (at the time of World War I, Spanish flu pandemic, and the Great Kanto earthquake).[clarification needed]
According to a demographic study conducted by Japanese Ministry of Internal Affairs and Communications, Japanese population (including foreign residents) has declined from 128 million people in 2010 to 124.3 million people in 2023, with a decrease of almost 511,000 people in one year.[18][19]

Graphs are unavailable due to technical issues. There is more info on Phabricator and on MediaWiki.org. |
Graphs are unavailable due to technical issues. There is more info on Phabricator and on MediaWiki.org. |
Graphs are unavailable due to technical issues. There is more info on Phabricator and on MediaWiki.org. |
Graphs are unavailable due to technical issues. There is more info on Phabricator and on MediaWiki.org. |
Population
Population Projection

-
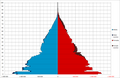
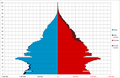
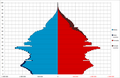
 Population pyramids of Japan 2065 (middle-birth, middle-death scenario case)[20]
 -
 Japan demographic transition 1888–2019
.svg)

Census
Japan collects census information every five years, with censuses conducted by the Statistics Bureau of the Ministry of Internal Affairs.[21][22] The latest population census reflects the situation as of 2020.[22]
Population density
Japan's population density was 336 people per square kilometer as of 2014 (874 people per square mile) according to World Development Indicators. It ranks 35th in a list of countries by population density. Between 1955 and 1989, land prices in the six largest cities increased by 15,000% (+12% per year compound). Urban land prices generally increased 40% from 1980 to 1987; in the six largest cities, the price of land doubled over that period. For many families, this trend put housing in central cities out of reach.[11]
The result was lengthy commutes for many workers in the big cities, especially in the Tokyo area where daily commutes of two hours each way are common.[11] In 1991, as the bubble economy started to collapse, land prices began a steep decline, and within a few years fell 60% below their peak.[23] After a decade of declining land prices, residents began moving back into central city areas (especially Tokyo's 23 wards), as evidenced by 2005 census figures. Despite nearly 70% of Japan being covered by forests,[24] parks in many major cities—especially Tokyo and Osaka—are smaller and scarcer than in major West European or North American cities. As of 2014, parkland per inhabitant in Tokyo is 5.78 square meters,[25] which is roughly half of the 11.5 square meters of Madrid.[26]
National and regional governments devote resources to making regional cities and rural areas more attractive by developing transportation networks, social services, industry, and educational institutions to try to decentralize settlement and improve the quality of life. Nevertheless, major cities, especially Tokyo, Yokohama and Fukuoka, and to a lesser extent Kyoto, Osaka and Nagoya, remain attractive to young people seeking education and jobs.[11]
Urban distribution

KANTO, KEIHANSHIN and TOKAI are three largest metropolitan areas which have about 2/3 of total population of Japan. Out of 47 prefectures, 13 are red and 34 are green.
The population of Japan has been decreasing since 2011. Only 8 prefectures had increased its population compared to 2010, due to internal migration to large cities.
| External images | |
|---|---|
| Views of the World | |
Japan has a high population concentration in urban areas on the plains since 75% of Japan's land area is made up of mountains,[28] and also Japan has a forest cover rate of 68.5% (the only other developed countries with such a high forest cover percentage are Finland and Sweden).[24] The 2010 census shows 90.7% of the total Japanese population live in cities.[29]
Japan is an urban society with about only 5% of the labor force working in agriculture. Many farmers supplement their income with part-time jobs in nearby towns and cities. About 80 million of the urban population is heavily concentrated on the Pacific shore of Honshu.[30]
Metropolitan Tokyo-Yokohama, with its population of 35 million residents, is the world's most populous city. Japan faces the same problems that confront urban industrialized societies throughout the world: overcrowded cities and congested highways.
Age structure
Japan's population is aging faster than that of any other nation.[31] The population of those 65 years or older roughly doubled in 24 years, from 7.1% of the population in 1970 to 14.1% in 1994. The same increase took 61 years in Italy, 85 years in Sweden, and 115 years in France.[32] In 2014, 26% of Japan's population was estimated to be 65 years or older,[33] and the Health and Welfare Ministry has estimated that over-65s will account for 40% of the population by 2060.[34] The demographic shift in Japan's age profile has triggered concerns about the nation's economic future and the viability of its welfare state.[35]
-
 1888
1888 -
 1920 (1st national census of population)
 -
 1925 (2nd national census of population)
 -
 1930 (3rd national census of population)
 -
 1935 (4th national census of population)
 -
 1940 (5th national census of population)
 -
 1947 (6th national census of population)
 -
 1950 (7th national census of population)
 -
 1955 (8th national census of population)
 -
 1960 (9th national census of population)
 -
 1965 (10th national census of population)
 -
 1970 (11th national census of population)
 -
 1975 (12th national census of population)
 -
 1980 (13th national census of population)
 -
 1985 (14th national census of population)
 -
 1990 (15th national census of population)
 -
 1995 (16th national census of population)
 -
 2000 (17th national census of population)
 -
 2005 (18th national census of population)
 -
 2010 (19th national census of population)
 -
 2015 (20th national census of population)
 -
 2019 estimate
 -
 Live births and deaths of Japan (1946–2019)


.png)
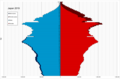
- Population pyramids of Japans prefectures in 2020
-
 Tokyo
Tokyo -
 Nagasaki
 -
 Hiroshima
 -
 Hokkaido
 -
 Kyoto
Kyoto -
 Aichi
Aichi -
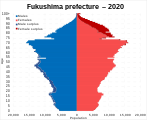 Fukushima
 -
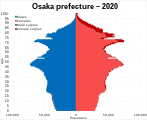 Osaka
Osaka -
 Okinawa
 -
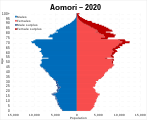 Aomori
 -
 Akita
Akita -
 Chiba
Chiba -
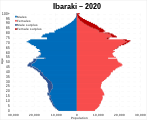 Ibaraki
 -
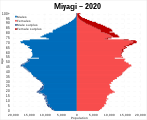 Miyagi
 -
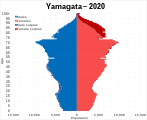 Yamagata
 -
 Iwate
Iwate -
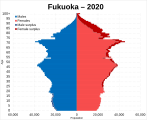 Fukuoka
 -
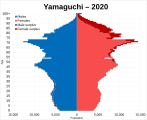 Yamaguchi
 -
 Saga
Saga -
 Okayama
 -
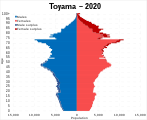 Toyama
 -
 Hyogo
Hyogo -
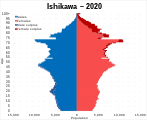 Ishikawa
 -
 Niigata
 -
 Fukui
Fukui -
 Ehime
Ehime -
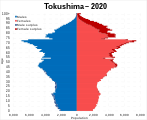 Tokushima
 -
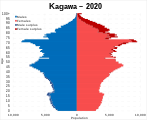 Kagawa
 -
 Miyazaki
 -
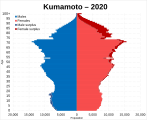 Kumamoto
 -
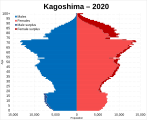 Kagoshima
 -
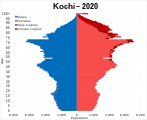 Kochi
Kochi -
 Yamanashi
 -
 Oita
Oita -
 Kanagawa
 -
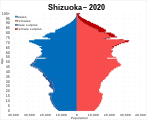 Shizuoka
 -
 Mie
Mie -
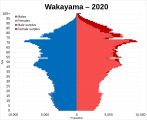 Wakayama
 -
 Saitama
 -
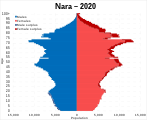 Nara
Nara -
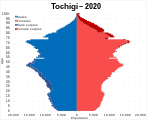 Tochigi
 -
 Nagano
 -
 Gunma
Gunma -
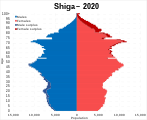 Shiga
Shiga -
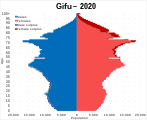 Gifu
Gifu -
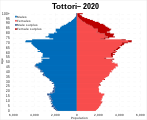 Tottori
 -
 Shimane


| Year | Total population (census; in thousands) |
Population by age (%) | ||
|---|---|---|---|---|
| 0–14 | 15–64 | 65+ | ||
| 1935 | 69,254 | 36.9 | 58.5 | 4.7 |
| 1940 | 73,114 | 36.1 | 59.2 | 5.7 |
| 1945 | 71,998 | 36.8 | 58.1 | 5.1 |
| 1950 | 83,199 | 35.4 | 59.6 | 4.9 |
| 1955 | 89,275 | 33.4 | 61.2 | 5.3 |
| 1960 | 93,418 | 30.2 | 64.1 | 5.7 |
| 1965 | 98,274 | 25.7 | 68.0 | 6.3 |
| 1970 | 103,720 | 24.0 | 68.9 | 7.1 |
| 1975 | 111,939 | 24.3 | 67.7 | 7.9 |
| 1980 | 117,060 | 23.5 | 67.3 | 9.1 |
| 1985 | 121,048 | 21.5 | 68.2 | 10.3 |
| 1990 | 123,611 | 18.2 | 69.5 | 12.0 |
| 1995 | 125,570 | 15.9 | 69.4 | 14.5 |
| 2000 | 126,925 | 14.6 | 67.9 | 17.3 |
| 2005 | 127,767
Zdroj:https://en.wikipedia.org?pojem=Demographics_of_Japan Text je dostupný za podmienok Creative Commons Attribution/Share-Alike License 3.0 Unported; prípadne za ďalších podmienok. Podrobnejšie informácie nájdete na stránke Podmienky použitia.
Analytika
Antropológia Aplikované vedy Bibliometria Dejiny vedy Encyklopédie Filozofia vedy Forenzné vedy Humanitné vedy Knižničná veda Kryogenika Kryptológia Kulturológia Literárna veda Medzidisciplinárne oblasti Metódy kvantitatívnej analýzy Metavedy Metodika Text je dostupný za podmienok Creative
Commons Attribution/Share-Alike License 3.0 Unported; prípadne za ďalších
podmienok. www.astronomia.sk | www.biologia.sk | www.botanika.sk | www.dejiny.sk | www.economy.sk | www.elektrotechnika.sk | www.estetika.sk | www.farmakologia.sk | www.filozofia.sk | Fyzika | www.futurologia.sk | www.genetika.sk | www.chemia.sk | www.lingvistika.sk | www.politologia.sk | www.psychologia.sk | www.sexuologia.sk | www.sociologia.sk | www.veda.sk I www.zoologia.sk | |||