

A | B | C | D | E | F | G | H | CH | I | J | K | L | M | N | O | P | Q | R | S | T | U | V | W | X | Y | Z | 0 | 1 | 2 | 3 | 4 | 5 | 6 | 7 | 8 | 9
Chichester District Council elections
...Chichester District Council in West Sussex, England is elected every four years. Since the last boundary changes in 2019, 36 councillors have been elected from 21 wards.
Council elections
- 1973 Chichester District Council election
- 1976 Chichester District Council election
- 1979 Chichester District Council election (New ward boundaries)[1]
- 1983 Chichester District Council election
- 1987 Chichester District Council election (District boundary changes took place but the number of seats remained the same)[2]
- 1991 Chichester District Council election
- 1995 Chichester District Council election (District boundary changes took place but the number of seats remained the same)[3][4]
- 1999 Chichester District Council election
- 2003 Chichester District Council election (New ward boundaries reduced the number of seats by 2)[5][6]
- 2007 Chichester District Council election
- 2011 Chichester District Council election
- 2015 Chichester District Council election
- 2019 Chichester District Council election (New ward boundaries reduced the number of seats by 12)[7]
- 2023 Chichester District Council election
Election results
| Overall control | Conservative | Lib Dems | Labour | Green | Local Alliance | Independent | |||||||
| 2023 | LD | 5 | 25 | - | 2 | 4 | - | ||||||
| 2019 | NOC | 18 | 11 | 2 | 2 | 2 | 1 | ||||||
| 2015 | Con | 42 | 3 | - | - | - | 3 | ||||||
| 2011 | Con | 38 | 8 | - | - | - | 2 | ||||||
| 2007 | Con | 34 | 11 | - | - | - | 3 | ||||||
| 2003 | Con | 26 | 21 | - | - | - | 1 | ||||||
Results maps
-
 2019 results map
 -
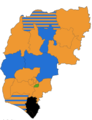 2023 results map


By-election results
1995–1999
| Party | Candidate | Votes | % | ±% | |
|---|---|---|---|---|---|
| Conservative | 607 | 51.8 | +7.5 | ||
| Liberal Democrats | 482 | 41.1 | -14.6 | ||
| Labour | 65 | 5.5 | +5.5 | ||
| Independent | 18 | 1.5 | +1.5 | ||
| Majority | 125 | 10.7 | |||
| Turnout | 1,172 | ||||
| Conservative gain from Liberal Democrats | Swing | ||||
| Party | Candidate | Votes | % | ±% | |
|---|---|---|---|---|---|
| Liberal Democrats | 673 | 50.2 | -2.0 | ||
| Conservative | 425 | 31.7 | +7.8 | ||
| Labour | 242 | 18.1 | -5.8 | ||
| Majority | 248 | 18.5 | |||
| Turnout | 1,340 | ||||
| Liberal Democrats hold | Swing | ||||
| Party | Candidate | Votes | % | ±% | |
|---|---|---|---|---|---|
| Liberal Democrats | 688 | 56.3 | +0.4 | ||
| Conservative | 341 | 27.9 | +5.2 | ||
| Labour | 193 | 15.8 | -5.6 | ||
| Majority | 347 | 28.4 | |||
| Turnout | 1,222 | ||||
| Liberal Democrats hold | Swing | ||||
1999–2003
| Party | Candidate | Votes | % | ±% | |
|---|---|---|---|---|---|
| Liberal Democrats | 595 | 66.0 | +35.5 | ||
| Conservative | 249 | 27.6 | -35.7 | ||
| UKIP | 57 | 6.3 | +6.3 | ||
| Majority | 346 | 38.4 | |||
| Turnout | 901 | 35.4 | |||
| Liberal Democrats gain from Conservative | Swing | ||||
| Party | Candidate | Votes | % | ±% | |
|---|---|---|---|---|---|
| Conservative | 418 | 51.7 | -10.3 | ||
| UKIP | 186 | 23.0 | +23.0 | ||
| Liberal Democrats | 159 | 19.7 | -6.7 | ||
| Labour | 46 | 5.7 | -5.9 | ||
| Majority | 232 | 28.7 | |||
| Turnout | 809 | 32.9 | |||
| Conservative hold | Swing | ||||